. 2008 Jun;68(5):1315-27.
doi: 10.1111/j.1365-2958.2008.06236.x. Epub 2008 Apr 22.

Lipid spirals in Bacillus subtilis and their role in cell division

Affiliations

Lipid spirals in Bacillus subtilis and their role in cell division

Imrich Barák et al. Mol Microbiol. 2008 Jun.

Abstract

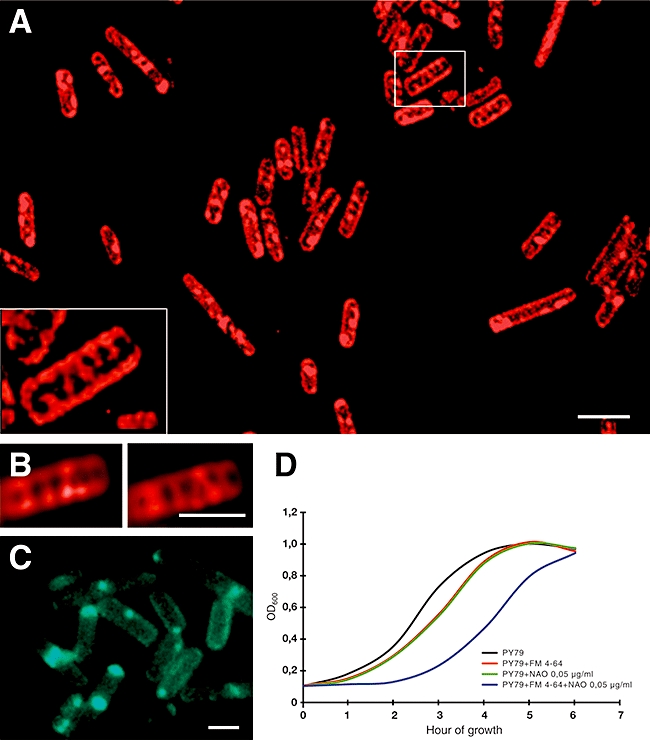
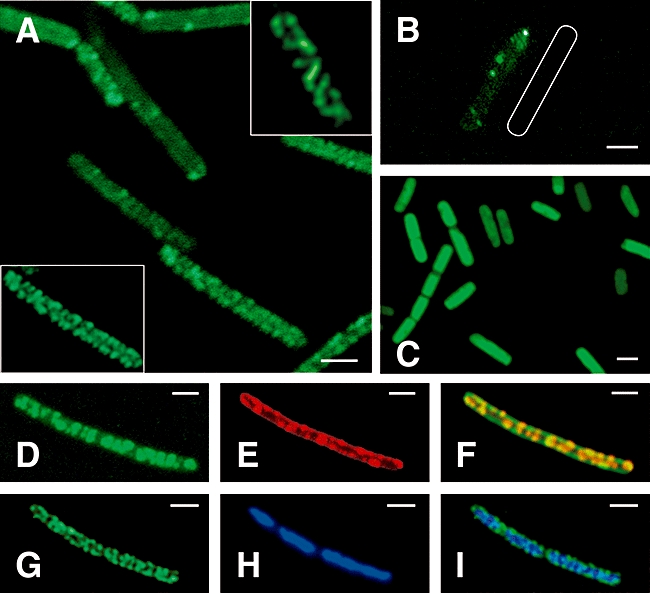
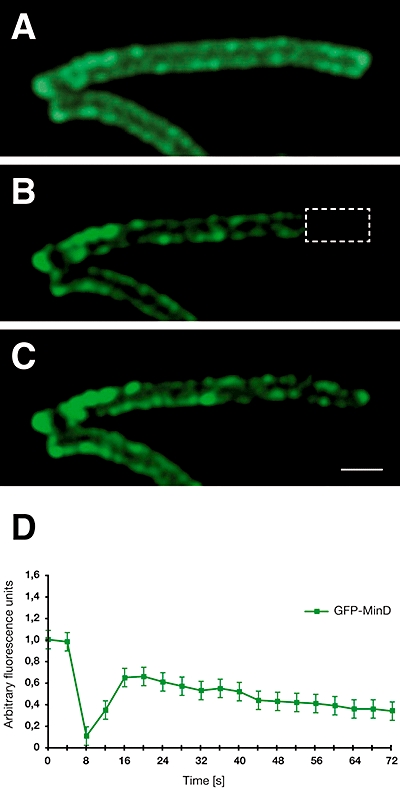
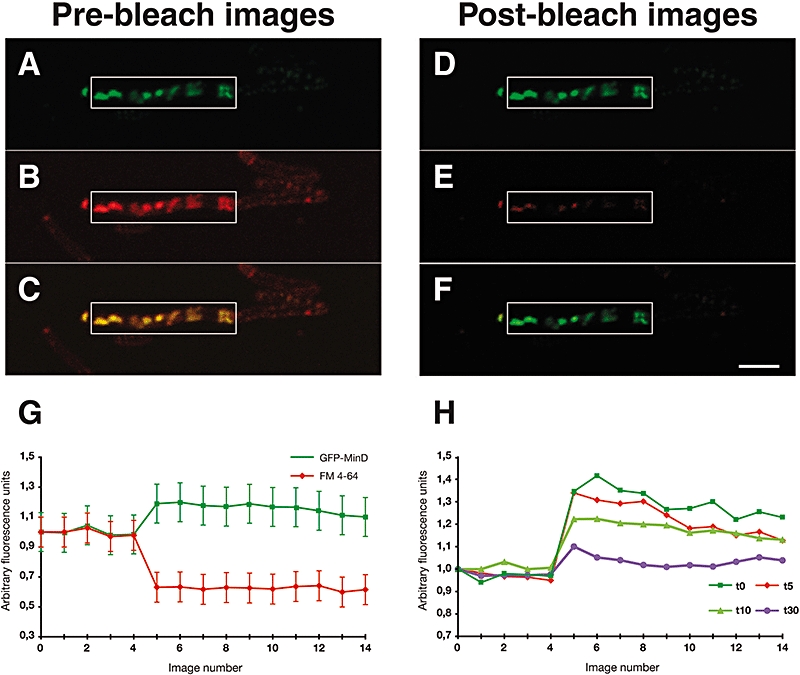
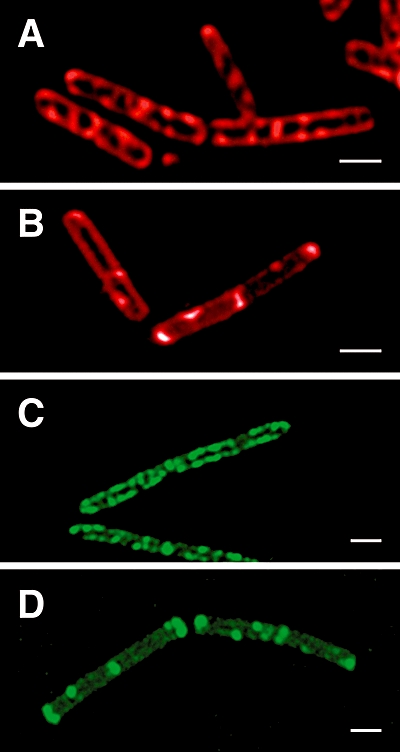
The fluid mosaic model of membrane structure has been revised in recent years as it has become evident that domains of different lipid composition are present in eukaryotic and prokaryotic cells. Using membrane binding fluorescent dyes, we demonstrate the presence of lipid spirals extending along the long axis of cells of the rod-shaped bacterium Bacillus subtilis. These spiral structures are absent from cells in which the synthesis of phosphatidylglycerol is disrupted, suggesting an enrichment in anionic phospholipids. Green fluorescent protein fusions of the cell division protein MinD also form spiral structures and these were shown by fluorescence resonance energy transfer to be coincident with the lipid spirals. These data indicate a higher level of membrane lipid organization than previously observed and a primary role for lipid spirals in determining the site of cell division in bacterial cells.


Figures

Fig. 1
Fig. 1
Lipid spirals in B. subtilis. A. Visualization of FM 4-64 (red) signals in wild-type B. subtilis. The lipid helices were discerned by assembling a series of Z-stack images taken in successive planes followed by sharpening by deconvolution (inset images). B. FM 4-64 signals in two different focal planes of a deconvolved cell. C. Staining of wild-type B. subtilis with NAO to visualize cardiolipin domains at the poles and at the site of septation. D. Growth curves of wild-type B. subtilis grown in DSM media without supplement (black), supplemented with FM 4-64 (red), NAO (green) and their combination (blue). Each growth curve represents the average of data from three independent experiments. The graph shows the evident negative effect on cell growth when both dyes are present. Scale bar for A is 2 μm and for B and C, 1 μm.
Fig. 2
Fig. 2
MinD spirals in B. subtilis. Visualization of GFP–MinD (green) signals in strain IB1060 (A) and MinD immunofluorescence (green) signals in strain IB1062 (B) by fluorescence microscopy. A shows the localization of GFP fused to MinD in strain IB1060 after gfp-minD induction with 0.1% xylose while C shows the GFP (green) signal in the control strain IB1073, following similar induction. B shows imunnofluorescence analysis of MinD localization in strain IB1062 after minD induction with 0.05% xylose where MinD is localized preferentially at the cell poles or at the site of septation, with a weak fluorescence signal radiating out from one of the poles. The shape of the fluorescently imaged cell is drawn next to it as a white outline. Vegetative cells in all cases were grown to mid-exponential phase in DSM medium. D–F show confocal images of strain IB1060 after gfp–minD induction with 0.1% xylose; these are visualizations of GFP–MinD (D), FM 4-64 (E), and a rendered image of the overlay of the images in D and E (F). The brightness of the GFP–MinD spirals in IB1060 could be altered by varying the level of gfp–minD induction, suggesting that the spiral structures can accommodate varying amounts of protein. The GFP–MinD helices were discerned by assembling a series of Z-stack images taken in successive planes followed by sharpening by deconvolution (inset images in A) and rendering in the case of F. G and H are fluorescence microscopy visualizations of GFP–MinD and nucleoids stained with DAPI, respectively, in strain IB1060 after gfp–minD induction with 0.05% xylose. I is a merged image of G and H. Polar localization of GFP–MinD and GFP–MinD spirals surrounding the nucleoids are evident. Scale bars for all panels represent 1 μm.
Fig. 3
Fig. 3
FRAP analysis of MinD spirals. FRAP analysis of GFP–MinD in IB1060 after gfp–minD induction with 0.1% xylose. The marked segment of the cell was photobleached by exposure to 488 nm laser light and subsequently photographed every 4 s for several minutes. The cell is shown before the bleach (A), immediately after bleaching (B) and 12 s after bleaching (C). Graph D shows the change in intensity of GFP signals during the FRAP experiment as a function of time in seconds. Photo bleaching was initiated after t = 4 s. Scale bar for A–C is 1 μm.
Fig. 4
Fig. 4
Colocalization of the lipid and MinD spirals. FRET between GFP–MinD and lipids labelled with FM 4-64. Images A and D show the GFP–MinD (donor) fluorescence signal before and after photobleaching of the acceptor FM 4-64. A clear increase in fluorescence intensity can be seen. Images B and E show the FM 4-64 (acceptor) fluorescence signal before and after photobleaching. A decrease in intensity can clearly be seen within the marked region. Images C and F represent the merged images A, B and D, E respectively. Graph G shows the mean change in intensity of both fluorophores during the image acquisition time. A bleaching of FM 4-64 coincident with an increase in GFP fluorescence intensity is apparent. Graph H shows the change in intensity of GFP signals during the FRET experiments as a function of time. The dark-green curve (squares) represents cells observed immediately after plating onto agarose-coated glass slides. The light-green curve (triangles) represents cells observed after 10 min, the red curve (diamonds) cells observed after 15 min and the purple curve (circles) cells observed after 30 min. Scale bar for images A–F is 2 μm.
Fig. 5
Fig. 5
Dependence of lipid and GFP–MinD spiral formation on the presence of negatively charged lipids. A and B show FM 4-64 fluorescence signals for BFA2809 cells grown in the presence (A) or absence (B) of 100 μM IPTG. Images C and D are visualizations of GFP–MinD in IB1061 cells after gfp–minD induction with 0.1% xylose and growth in the presence (A) or absence (B) of 100 μM IPTG. Expression of pgsA from the IPTG-inducible promoter is required for the spiral localization of both the FM 4-64 dye and GFP–MinD (A and C). In the absence of IPTG (B and D), there is a redistribution of the FM 4-64 and GFP–MinD signals from the spirals (which are no longer evident) to the cell poles and to the sites of septation, where the relative fluorescence intensity increases. Scale bars for all images represent 1 μm.
Fig. 6
Fig. 6
The MTS is required for the spiral localization of GFP–MinD. A. The C-terminal residues of MinD with the MTS motif shown in red. A putative α-helix is drawn above the sequence of the wild-type MinD. The C-terminal deletion mutants analysed in this work are indicated below. B. Ribbon drawing of the crystal structure of MinD from Pyrococcus furiosus (light-blue ribbon) with bound Mg-ADP (cylinder representation and coloured by element) (1G3Q) (Hayashi et al., 2001). The C-terminal region is poorly ordered (with eight residues missing) in this structure and in two other structures of MinD from thermophiles (Cordell and Lowe, 2001; Hayashi et al., 2001; Sakai et al., 2001), consistent with the notion that the helical structure forms only upon membrane binding. C–G. Helical-wheel representation of the putative MTS in wild-type MinD and the MinD deletion derivatives alongside fluorescence micrographs showing the localization in B. subtilis cells of the respective proteins fused to GFP. Hydrophobic residues are denoted by white letters and positively charged residues are shown by red letters. Residue Lys254 (K254) and the C-terminal residues of MinD and its deletion derivatives are numbered.
Fig. 7
Fig. 7
Role of lipid and MinD spirals in cell division. Lipid spirals (red strips) and MinD (green spheres) spirals are shown in cells (A) overexpressing MinD–GFP and (B) expressing wild-type levels of MinD. The polar-localizing protein DivIVA is represented as black dots. MinD/MinD–GFP associates preferentially and reversibly with anionic phospholipids, which are enriched in the spirals, and is attracted by DivIVA to the cell poles. MinD–GFP overexpression in A produces elongated cells with visible fluorescent protein spirals along the length of the cell. With wild-type levels of MinD (B), we propose that the concentration gradient across the cell is sufficiently sensitive to serve as a measuring device for the mid-cell plane where MinD (and therefore MinC) concentrations are at a minimum. FtsZ and FtsA (blue spheres) also localize on spiral-like structures (Peters et al., 2007), accumulating where the MinCD concentration is lowest, leading to Z-ring formation at the mid-cell.

References

    1. Backman K, Ptashne M, Gilbert AW. Construction of plasmids carrying the cI gene of bacteriophage lambda. Proc Natl Acad Sci USA. 1976;73:4174–4178. - PMC - PubMed
    1. Barák I, Wilkinson AJ. Division site recognition in Escherichia coli and Bacillus subtilis. FEMS Microbiol Rev. 2007;31:311–326. - PubMed
    1. Ben-Yehuda S, Losick R. Asymmetric cell division in B. subtilis involves a spiral-like intermediate of the cytokinetic protein FtsZ. Cell. 2002;109:257–266. - PubMed
    1. Brumback AC, Lieber JL, Angleson JK, Betz WJ. Using FM1-43 to study neuropeptide granule dynamics and exocytosis. Methods. 2004;33:287–294. - PubMed
    1. Campo N, Tjalsma H, Buist G, Stepniak D, Meijer M, Veenhuis M, et al. Subcellular sites for bacterial protein export. Mol Microbiol. 2004;53:1583–1599. - PubMed

Publication types

MeSH terms