. 2008 Jun 20;283(25):17333-40.
doi: 10.1074/jbc.M800107200. Epub 2008 Apr 22.

Lipid rafts determine clustering of STIM1 in endoplasmic reticulum-plasma membrane junctions and regulation of store-operated Ca2+ entry (SOCE)

Affiliations

Lipid rafts determine clustering of STIM1 in endoplasmic reticulum-plasma membrane junctions and regulation of store-operated Ca2+ entry (SOCE)

Biswaranjan Pani et al. J Biol Chem. .

Abstract

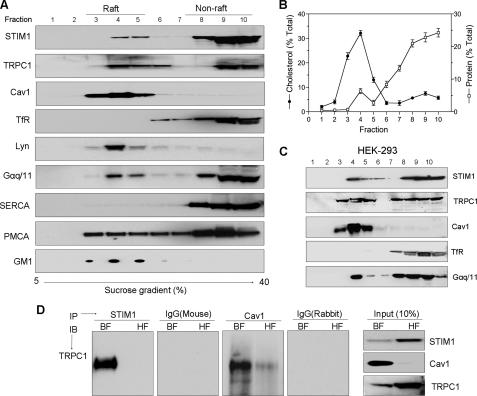
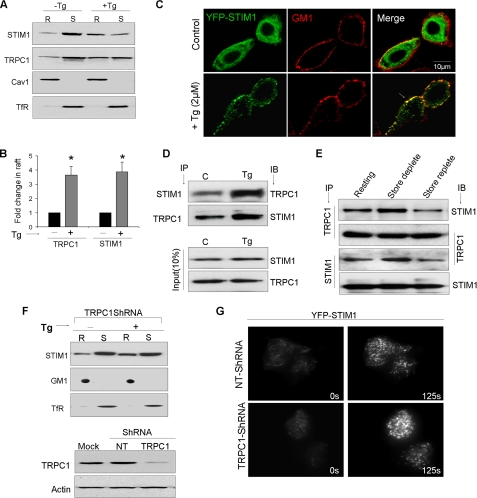
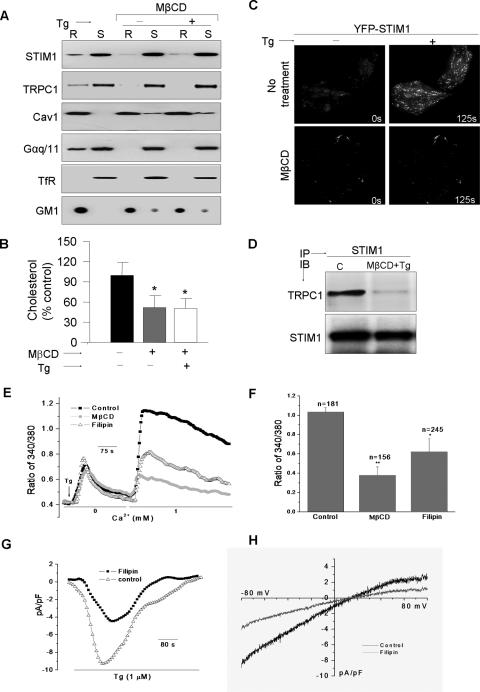
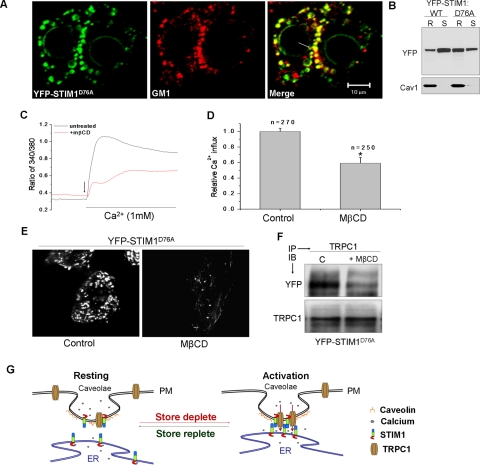
Store depletion induces STIM1 to aggregate and relocate into clusters at ER-plasma membrane junctions where it functionally interacts with and activates plasma membrane channels that mediate store-operated Ca(2+) entry (SOCE). Thus, the site of peripheral STIM1 clusters is critical for the regulation of SOCE. However, what determines the location of the STIM1 clusters in the ER-PM junctional regions, and whether these represent specific sites in the cell is not yet known. Here we report that clustering of STIM1 in the subplasma membrane region of the cell and activation of TRPC1-dependent SOCE are determined by lipid raft domains (LRD). We show that store depletion increased partitioning of TRPC1 and STIM1 into plasma membrane LRD. TRPC1 and STIM1 associated with each other within the LRD, and this association was dynamically regulated by the status of the ER Ca(2+) store. Peripheral STIM1 clustering was independent of TRPC1. However, sequestration of membrane cholesterol attenuated thapsigargin-induced clustering of STIM1 as well as SOCE in HSG and HEK293 cells. Recruitment and association of STIM1 and TRPC1 in LRD was also decreased. Additionally STIM1(D76A), which is peripherally localized and constitutively activates SOCE in unstimulated cells, displayed a relatively higher partitioning into LRD and interaction with TRPC1, as compared with STIM1. Disruption of membrane rafts decreased peripheral STIM1(D76A) puncta, its association with TRPC1 and the constitutive SOCE. Together, these data demonstrate that intact LRD determine targeting of STIM1 clusters to ER-plasma membrane junctions following store depletion. This facilitates the functional interaction of STIM1 with TRPC1 and activation of SOCE.


Figures

FIGURE 1.
FIGURE 1.
Lipid raft-associated STIM1 interacts with TRPC1. A, presence of proteins including STIM1 and TRPC1 density gradient fractions isolated from HSG cells demonstrate partitioning into raft and non-raft domains. B, total cholesterol and protein profiles in fractions shown in A. C, rafts association of STIM1 and TRPC1 in HEK293 cells. D, immunoprecipitation of endogenous TRPC1 using STIM1 and caveolin1 (Cav1) antibodies from pooled buoyant raft fractions 3–5 (BF) and from heavy non-raft fractions 8–10 (HF) of HSG cells. Respective IgGs were used as control; 10% of the inputs used for immunoprecipitation are indicated at the right.
FIGURE 2.
FIGURE 2.
Store-dependent movement of STIM1 and TRPC1 into lipid raft domains. A, Western blots showing STIM1 and TRPC1 in detergent-resistant raft (R) and soluble (S) fractions obtained from control (C) or stimulated (2 μm Tg, 5 min) cells. B, bar graph summarizing optical densities (OD) obtained from five individual experiments that are plotted as mean ± S.D. ODs of untreated samples were set to 1. * indicate significant difference than control (p < 0.05). C, confocal images of HSG cells showing the co-localization of YFP-STIM1 punctae (green) with the caveolar marker ganglioside GM1 (red) in resting cells and after store depletion with Tg. D, immunoprecipitation of STIM1 and TRPC1 from raft fractions obtained from control and Tg-stimulated HSG cells. E, immunoprecipitations of STIM1 and TRPC1 using raft fractions isolated from CCh-treated cells under conditions where store is depleted and after store refilling (replete). F, Western blots showing STIM1 movement in control and TRPC1-Sh-RNA-expressing cells. Lower panel shows TRPC1 protein levels in TRPC1-ShRNA or a NT-ShRNA-expressing cells. Actin is used as a loading control. G, TIRF imaging on cells expressing either a control or TRPC1-Sh-RNA in HSG cells.
FIGURE 3.
FIGURE 3.
Lipid raft integrity determines STIM1 clustering and SOCE. Conditions for raft disruption by MβCD or Filipin-III are described under “Experimental Procedures.” A, Western blots were performed using individual antibodies in raft and non-raft fractions as described in supplemental Table S1. B, quantification of total cholesterol expressed as mean ± S.D. from at least three individual experiments. * denotes groups that are significantly different (using analysis of variance) from control (p < 0.05), but not from each other. C, TIRF imaging was performed on HSG cells expressing YFP-STIM1, with and without MβCD treatment; acquired images reveal STIM1 punctae at 0 or 125 s post-Tg stimulation. D, immunoprecipitation demonstrating a requirement of membrane rafts for the functional association between endogenous STIM1 and TRPC1. E, Tg-stimulated Ca2+ mobilization and G, currents were measured as described in Ref. . F, indicates the averaged data and the number of cells (n) imaged. * denotes values significantly different from controls, and ** indicates values significantly different from both sets (p < 0.05). H, indicates the I-V curves with and without filipin treatment.
FIGURE 4.
FIGURE 4.
Lipid raft domains are essential for constitutive localization of STIM1D76A in the peripheral ER. A, confocal microscopy was performed on HSG cells expressing the D76A EF hand mutant of STIM1 (STIM1D76A). Pre-existing YFP-STIM1D76A punctae (green) co-localize with raft marker and GM1 (red), co-localization is indicated by an arrow. B represents raft and non-raft association of STIM1 and STIM1D76A. C, Ca2+ imaging was performed on cells expressing YFP-STIM1D76A treated with or without MβCD. Constitutive Ca2+ influxes were monitored by stimulating cells with the addition of 1 mm CaCl2 to the external medium (indicated by arrow). Averaged data and the number of cells (n) imaged are shown in D. * denotes values significantly different from control (p < 0.05). E, TIRFM images indicating YFP-STIM1D76A punctae sensitive to raft disruption. F, immunoprecipitations indicating dependence of membrane rafts for TRPC1 and STIM1D76A association. G, proposed model indicating raft recruitment of STIM1 as a step obligatory to SOCE.

References

    1. Berridge, M. J., Bootman, M. D., and Roderick, H. L. (2003) Nat. Rev. Mol. Cell Biol. 4 517-529 - PubMed
    1. Parekh, A. B., and Putney, J. W. (2005) Physiol. Rev. 85 757-810 - PubMed
    1. Putney, J. W., Jr. (1990) Cell Calcium 11 611-624 - PubMed
    1. Putney, J. W., Jr. (2007) Cell Calcium 42 103-110 - PMC - PubMed
    1. Venkatachalam, K., van Rossum, D. B., Patterson, R. L., Ma, H. T., and Gill, D. L. (2002) Nat. Cell Biol. 4 263-272 - PubMed

Publication types

MeSH terms

LinkOut - more resources