

Prostate cancer: is inapparent tumor at endorectal MR and MR spectroscopic imaging a favorable prognostic finding in patients who select active surveillance?
- PMID: 18430877
- PMCID: PMC3705558
- DOI: 10.1148/radiol.2472070770
Prostate cancer: is inapparent tumor at endorectal MR and MR spectroscopic imaging a favorable prognostic finding in patients who select active surveillance?
Abstract
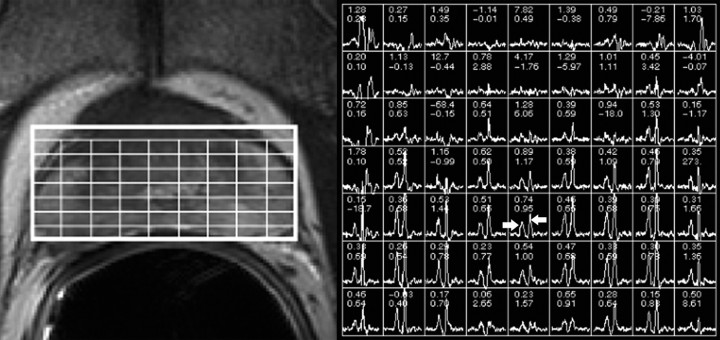
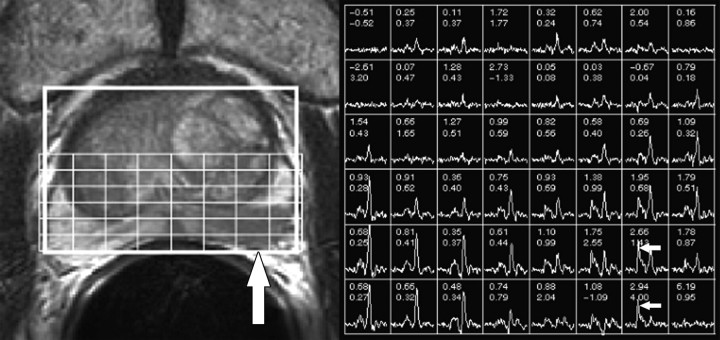
Purpose: To retrospectively determine whether inapparent tumor at endorectal magnetic resonance (MR) imaging and MR spectroscopic imaging is a favorable prognostic finding in prostate cancer patients who select active surveillance for management.
Materials and methods: Committee on Human Research approval was obtained and compliance with HIPAA regulations was observed, with waiver of requirement for written consent. Ninety-two men (mean age, 64 years; range, 43-85 years) were retrospectively identified who had biopsy-proved prostate cancer, who had undergone baseline endorectal MR imaging and MR spectroscopic imaging, and who had selected active surveillance for management. Their mean baseline serum prostate-specific antigen (PSA) level was 5.5 ng/mL, and the median Gleason score was 6. Two readers with 10 and 3 years of experience independently reviewed all MR images and determined whether tumor was apparent on the basis of evaluation of established morphologic and metabolic findings. Another investigator compiled data about baseline clinical stage, biopsy findings, and serum PSA measurements. Multiple logistic regression analysis was used to investigate the relationship between the clinical parameters and tumor apparency at MR imaging and the biochemical outcome.
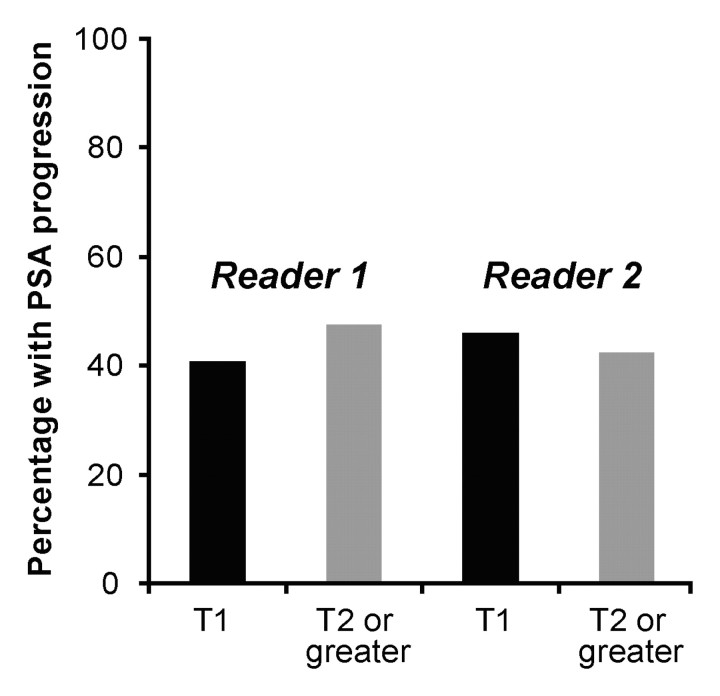
Results: At baseline MR imaging, readers 1 and 2 considered 54 and 26 patients, respectively, to have inapparent tumor (fair interobserver agreement; kappa = 0.30). During a mean follow-up of 4.8 years, 52 patients had a stable PSA level and 40 had an increasing PSA level. In multivariate analysis, no significant association was found between the baseline clinical stage, Gleason score, serum PSA level, or the presence of apparent tumor at endorectal MR imaging and MR spectroscopic imaging for either reader and the biochemical outcome (P > .05 for all).
Conclusion: Endorectal MR imaging and MR spectroscopic imaging findings of tumor apparency or inapparency in prostate cancer patients who select active surveillance for management do not appear to be of prognostic value.
(c) RSNA, 2008.
Figures
Similar articles
-
Prediction of seminal vesicle invasion in prostate cancer: incremental value of adding endorectal MR imaging to the Kattan nomogram.Radiology. 2007 Jan;242(1):182-8. doi: 10.1148/radiol.2421051254. Epub 2006 Nov 7. Radiology. 2007. PMID: 17090712
-
Prostate cancer: incremental value of endorectal MR imaging findings for prediction of extracapsular extension.Radiology. 2004 Jul;232(1):133-9. doi: 10.1148/radiol.2321031086. Epub 2004 May 27. Radiology. 2004. PMID: 15166321
-
Prostate cancer localization with endorectal MR imaging and MR spectroscopic imaging: effect of clinical data on reader accuracy.Radiology. 2004 Jan;230(1):215-20. doi: 10.1148/radiol.2301021562. Radiology. 2004. PMID: 14695396
-
Prostate cancer: role of pretreatment MR in predicting outcome after external-beam radiation therapy--initial experience.Radiology. 2008 Apr;247(1):141-6. doi: 10.1148/radiol.2471061982. Epub 2008 Feb 7. Radiology. 2008. PMID: 18258811 Free PMC article.
-
Combined modality staging of prostate carcinoma and its utility in predicting pathologic stage and postoperative prostate specific antigen failure.Urology. 1997 Mar;49(3A Suppl):23-30. doi: 10.1016/s0090-4295(97)00165-9. Urology. 1997. PMID: 9123732 Review.
Cited by
-
Image-based monitoring of targeted biopsy-proven prostate cancer on active surveillance: 11-year experience.World J Urol. 2016 Feb;34(2):221-7. doi: 10.1007/s00345-015-1619-z. Epub 2015 Jun 21. World J Urol. 2016. PMID: 26093647 Free PMC article.
-
Can high-spatial resolution T2-weighted endorectal MRI rule out clinically significant prostate cancer?World J Urol. 2014 Apr;32(2):379-83. doi: 10.1007/s00345-013-1106-3. Epub 2013 Jun 11. World J Urol. 2014. PMID: 23754478
-
Magnetic resonance imaging on disease reclassification among active surveillance candidates with low-risk prostate cancer: a diagnostic meta-analysis.Prostate Cancer Prostatic Dis. 2015 Sep;18(3):221-8. doi: 10.1038/pcan.2015.20. Epub 2015 May 19. Prostate Cancer Prostatic Dis. 2015. PMID: 25986915 Review.
-
Abnormal findings on multiparametric prostate magnetic resonance imaging predict subsequent biopsy upgrade in patients with low risk prostate cancer managed with active surveillance.Abdom Imaging. 2014 Oct;39(5):1027-35. doi: 10.1007/s00261-014-0136-7. Abdom Imaging. 2014. PMID: 24740760 Free PMC article.
-
Magnetic resonance spectroscopic imaging of benign prostatic tissue: findings at 3.0 T compared to 1.5 T-initial experience.Clin Imaging. 2011 Jul-Aug;35(4):288-93. doi: 10.1016/j.clinimag.2010.07.005. Clin Imaging. 2011. PMID: 21724122 Free PMC article.
References
-
- Sakr WA, Grignon DJ. Prostate cancer: indicators of aggressiveness. Eur Urol 1997;32(suppl 3):15–23. - PubMed
-
- Kattan MW, Eastham JA, Wheeler TM, et al. Counseling men with prostate cancer: a nomogram for predicting the presence of small, moderately differentiated, confined tumors. J Urol 2003;170:1792–1797. - PubMed
-
- Wu H, Sun L, Moul JW, et al. Watchful waiting and factors predictive of secondary treatment of localized prostate cancer. J Urol 2004;171:1111–1116. - PubMed
-
- Liebross RH, Pollack A, Lankford SP, von Eschenbach AC, Zagars GK. Relationship of ultrasound staging and bilateral biopsy positivity to outcome in stage T1c prostate cancer treated with radiotherapy. Urology 1998;52:647–652. - PubMed
-
- Philip J, Dutta Roy S, Ballal M, Foster CS, Javlé P. Is a digital rectal examination necessary in the diagnosis and clinical staging of early prostate cancer? BJU Int 2005;95:969–971. - PubMed
Publication types
MeSH terms
Grants and funding
LinkOut - more resources
Full Text Sources
Medical
Research Materials
Miscellaneous
