

doi: 10.1534/genetics.107.084624.
Estimation of pairwise identity by descent from dense genetic marker data in a population sample of haplotypes
Affiliations
- PMID: 18430938
- PMCID: PMC2323802
- DOI: 10.1534/genetics.107.084624
Item in Clipboard
Estimation of pairwise identity by descent from dense genetic marker data in a population sample of haplotypes
Genetics.
2008 Apr.
Abstract
I present a new approach for calculating probabilities of identity by descent for pairs of haplotypes. The approach is based on a joint hidden Markov model for haplotype frequencies and identity by descent (IBD). This model allows for linkage disequilibrium, and the method can be applied to very dense marker data. The method has high power for detecting IBD tracts of genetic length of 1 cM, with the use of sufficiently dense markers. This enables detection of pairwise IBD between haplotypes from individuals whose most recent common ancestor lived up to 50 generations ago.
Figures
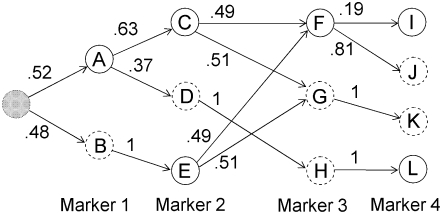
Example of a localized haplotype cluster model. Nodes of the graph represent haplotype clusters (labeled A–L). Solid boundaries around nodes represent allele 1 while dashed boundaries represent allele 2. The initial state is shaded gray. Transition probabilities are given on the edges.
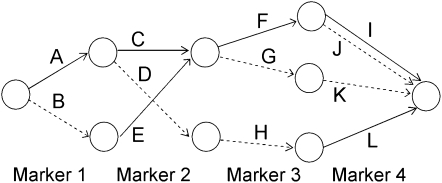
An alternative representation of the localized haplotype cluster model in Figure 1. This representation is given solely for comparison with previous work (for example, Browning 2006). Edges of the graph represent the haplotype clusters. Solid edges represent allele 1 while dashed edges represent allele 2.
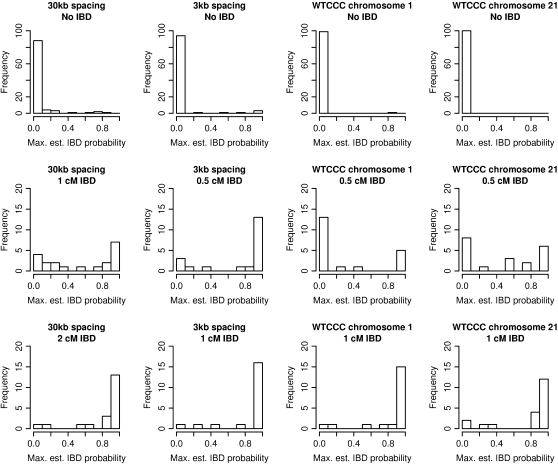
Estimated IBD probabilities. Histograms of maximum estimated IBD probabilities from each region. (Top) Results from pairs of haplotypes with no IBD. (Middle) Results from pairs of haplotypes with short tracts of IBD. (Bottom) Results from pairs of haplotypes with long tracts of IBD. The genetic lengths given are approximate.
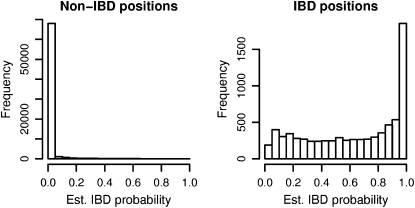
Estimated IBD probabilities for random IBD data. IBD tracts were inserted in pairs of simulated haplotypes at random according to the prior distribution. IBD probabilities were estimated at both IBD and non-IBD positions, and these probabilities are shown in the two histograms.
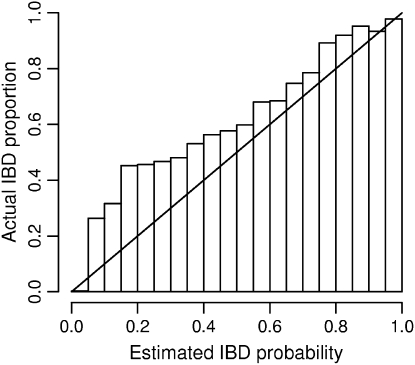
Accuracy of estimated IBD probabilities. IBD tracts were inserted in pairs of simulated haplotypes at random according to the prior distribution. IBD probabilities were estimated at both IBD and non-IBD positions. Within each bin shown on the x-axis, the locations having an estimated IBD probability falling within the bin are considered. Of those locations falling into the bin, the proportion of locations that are actually part of an IBD tract is shown by the height of the bar for that bin. As the distribution of IBD follows the same distribution as the prior used in the IBD estimation, actual proportions should ideally match the estimated probabilities and thus fall close to the diagonal line.
References
-
- Baum, L. E., 1972. An inequality and associated maximization technique in statistical estimation for probabilistic functions on Markov processes, pp. 1–8 in Inequalities. III. Proceedings of the Third Symposium on Inequalities. Academic Press, New York.
-
- Beckmann, L., D. C. Thomas, C. Fischer and J. Chang-Claude, 2005. Haplotype sharing analysis using Mantel statistics. Hum. Hered. 59 67–78. - PubMed
-
- Browning, B. L., and S. R. Browning, 2007. Efficient multilocus association mapping for whole genome association studies using localized haplotype clustering. Genet. Epidemiol. 31 365–375. - PubMed
Publication types
MeSH terms
Substances
Grants and funding
LinkOut - more resources
Full Text Sources
Other Literature Sources
