. 2008 Apr 23;3(4):e1994.
doi: 10.1371/journal.pone.0001994.

Sorting signals, N-terminal modifications and abundance of the chloroplast proteome

Affiliations

Sorting signals, N-terminal modifications and abundance of the chloroplast proteome

Boris Zybailov et al. PLoS One. .

Abstract

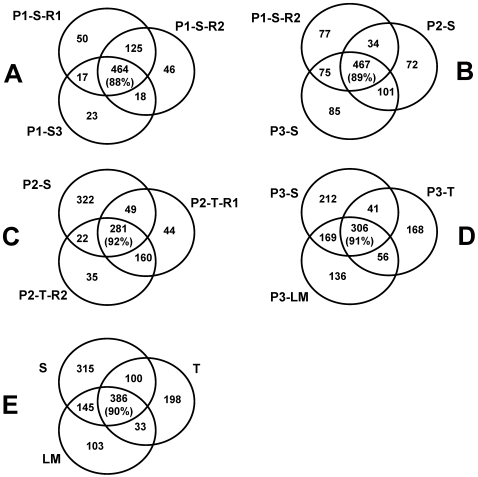
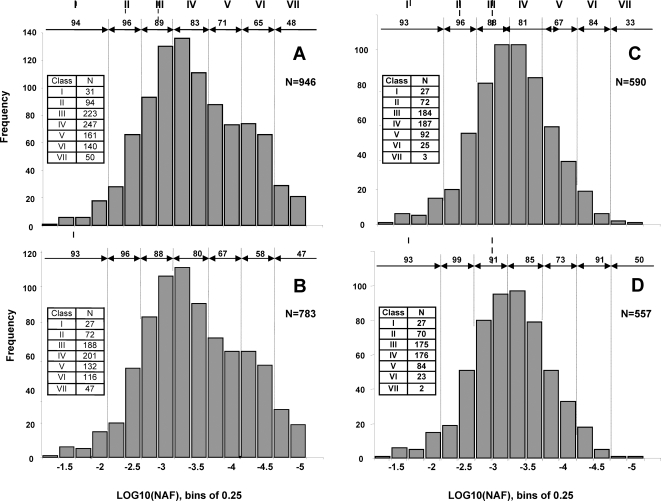
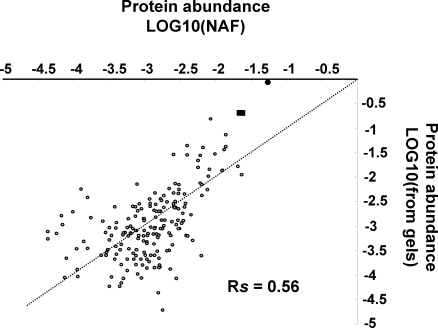
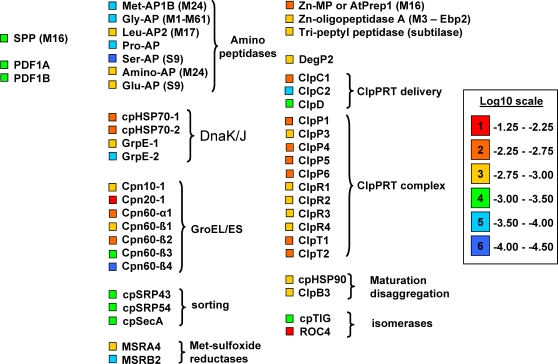
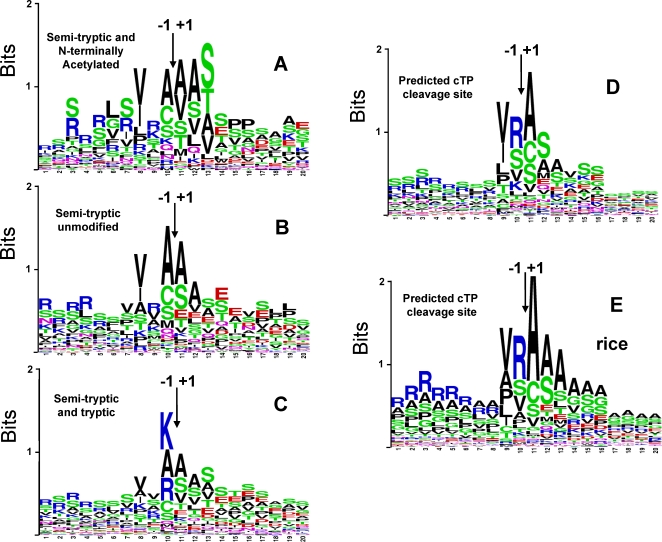
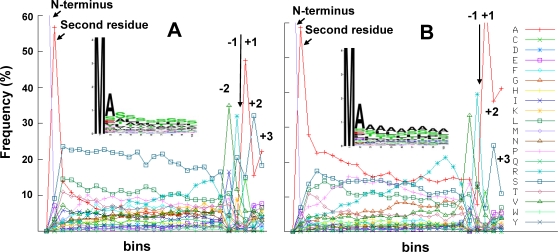
Characterization of the chloroplast proteome is needed to understand the essential contribution of the chloroplast to plant growth and development. Here we present a large scale analysis by nanoLC-Q-TOF and nanoLC-LTQ-Orbitrap mass spectrometry (MS) of ten independent chloroplast preparations from Arabidopsis thaliana which unambiguously identified 1325 proteins. Novel proteins include various kinases and putative nucleotide binding proteins. Based on repeated and independent MS based protein identifications requiring multiple matched peptide sequences, as well as literature, 916 nuclear-encoded proteins were assigned with high confidence to the plastid, of which 86% had a predicted chloroplast transit peptide (cTP). The protein abundance of soluble stromal proteins was calculated from normalized spectral counts from LTQ-Obitrap analysis and was found to cover four orders of magnitude. Comparison to gel-based quantification demonstrates that 'spectral counting' can provide large scale protein quantification for Arabidopsis. This quantitative information was used to determine possible biases for protein targeting prediction by TargetP and also to understand the significance of protein contaminants. The abundance data for 550 stromal proteins was used to understand abundance of metabolic pathways and chloroplast processes. We highlight the abundance of 48 stromal proteins involved in post-translational proteome homeostasis (including aminopeptidases, proteases, deformylases, chaperones, protein sorting components) and discuss the biological implications. N-terminal modifications were identified for a subset of nuclear- and chloroplast-encoded proteins and a novel N-terminal acetylation motif was discovered. Analysis of cTPs and their cleavage sites of Arabidopsis chloroplast proteins, as well as their predicted rice homologues, identified new species-dependent features, which will facilitate improved subcellular localization prediction. No evidence was found for suggested targeting via the secretory system. This study provides the most comprehensive chloroplast proteome analysis to date and an expanded Plant Proteome Database (PPDB) in which all MS data are projected on identified gene models.


Conflict of interest statement

Competing Interests: The authors have declared that no competing interests exist.

Figures

Figure 1
Figure 1. Identification of Chloroplast Proteins by nanoLC-LTQ-Orbitrap MS/MS.
Venn diagrams show overlap between proteins identified in different preparations. Letter S denote soluble fractions, letter T denotes membrane fractions, letters LM denote low density membrane fraction, (A) Proteins identified in three technical stromal replicates of Chloroplast preparation 1, (B) Proteins identified in three biological replicates of stromal samples – chloroplast preparation 1 (technical replicate 2), chloroplast preparation 2, and chloroplast preparation 3, (C) Proteins identified in stromal and membrane (two technical replicates thereof) fractions of Chloroplast preparation 2, (D) Proteins identified in the three different fractions of Chloroplast Preparation 3, (E) Overlap between three sample types from all replicates combined. Number in parentheses is the percentage of proteins localized in chloroplast according to TargetP.
Figure 2
Figure 2. Frequency distribution of relative concentrations of soluble chloroplast proteins.
Log10 abundance of stromal proteins were calculated from normalized SPC and corrected for predicted full tryptic peptides of the mature proteins within mass window of 700–3500 Da. Corrections were made for shared peptides as described in the Material and Method section. Each bin on the x-axis corresponds to 0.25 order of magnitude, with the total population spanning five orders of magnitude. The bins are grouped into seven abundance classes (I–VII, with I representing proteins of highest abundance). The percentage of chloroplast predicted nuclear-encoded proteins by TargetP (% cTP) is indicated. (A) Frequency distribution for the 946 proteins in the initial (unfiltered) dataset from stromal samples, (B,C,D) Frequency distribution of stromal protein after application of successive filters, as follows i) after known non-stromal chloroplast proteins (i.e. thylakoid, lumen, envelope) were removed (B), when only including proteins observed in 2 or more independent preparations (C), after removal of non-chloroplast contaminants (D).
Figure 3
Figure 3. Cross-correlation between relative concentrations of stromal proteins quantified by spectral counting and by image analysis of gel separated proteins.
Stromal protein quantified in a previous study from image analysis of stained 2-dimensional native gels (weighted for experimental protein mass) were directly correlated to MS based quantified from the current LTQ data set. Log10 abundance of stromal proteins were calculated from normalized SPC and corrected for predicted full tryptic peptides of the mature proteins within mass window of 700–3500 Da. This showed strong positive correlation as indicated by a Spearman correlation coefficient of 0.56.
Figure 4
Figure 4. Quantification of the chloroplast protein homeostasis network including processing, (un)folding, maturation and proteolysis.
Relative concentrations of 48 stromal proteins involved in the post-translational protein homeostasis network are displayed with color coding. Abbreviations are as follows: SPP, general stromal processing peptidase; PDF1A,B, methionine deformylases 1A,B; MSRA4,B2, methionine sulfoxide reductases; AP, amino-peptidases; CPN10,20,60, chaperone 10,20 and 60 of the GroEL/ES system; cpHSP70, heat shock protein 70; GrpE, nucleotide exchange factor; HSP90, heat shock protein 90; ClpB3, chaperone B3; cpSRP – chloroplast signal recognition particle subunit 43 and 54, involved in protein targeting components cpSRP43, cpSRP54; cpSecA – ATP-dependent Sec targeting component; cpTIG, a homologue of E. coli trigger factor involved in protein folding at the ribosome; ROC4, protein isomerase with unknown function; ClpP/R/S,T,C,D- subunits of the complete Clp protease system, DegP2 – protease of the Deg family; AtPrep1 - a Zn-protease suggested to be involved in degradation of processed cTPs; Zn-oligopeptidase A, homologue of a peptidase that in E. coli was suggested to degrade small peptides down-stream of the Clp protease system; TPPII, tripeptyl peptidase.
Figure 5
Figure 5. Tandem MS spectra of N-terminally acetylated peptides suggest presence of two isoforms of Cysteine Synthase, AT2G43750.1.
(A) Tandem MS spectrum of doubly charged 25 aa-long, N-terminally acetylated AVSIKPEAGVEGLNIADNAAQLIGK peptide. Precursor ion is indicated with red asteric. Singly charged y ions are indicated by blue lines with corresponding aa residues shown on top - peptide sequence should be read right-to-left, starting with the most massive y(20) ion. Singly charged b ions are indicated by red lines with corresponding aa residues shown top – peptide sequence should be read left-to-right, starting with the lightest b(4) ion. Ions, whose presence strengthen the assignment of the N-terminal acetylation, b0(4), y++(23), and y++(24) are also indicated. (B) Tandem MS spectrum of doubly charged 24 aa-long, N-terminally acetylated VSIKPEAGVEGLNIADNAAQLIGK peptide. Precursor ion is indicated with red asteric. Singly charged y ions are indicated by blue lines with corresponding aa residues shown on top - peptide sequence should be read from right-to-left, starting with the most massive y(20) ion. Ions, whose presence strengthen the assignment of the N-terminal acetylation, y++(21), and y++(23) are also indicated.
Figure 6
Figure 6. Consensus Sequences of the sites of cTP cleavage in chloroplast proteins.
(A) Sequence logo of the cTP cleavage site, constructed for proteins, for which N-terminally Acetylated semi-tryptic peptides within 10 residues from predicted cTP cleavage site were observed by MS. N-terminally acetylated residue was assumed to represent true cTP cleavage site. (B) Sequence logo of cTP cleavage site, constructed for proteins, for which only non-modified semi-tryptic peptides within 10 residues from predicted cTP cleavage site were observed by MS. N-terminal residue of the semi-tryptic peptide closest to predicted cTP cleavage site was assumed to represent true cTP cleavage site. (C) Sequence logo of 203 stromal proteins for which the most N-terminal peptide (full tryptic or the semi-tryptic peptide) was within 10 residues of the predicted cTP, (D) Sequence logo of the predicted cTP of all 898 annotated Arabidopsis chloroplast proteins, but only those proteins (831) were used with a predicted cTP length of at least 20 aa residues. (E) Sequence logo of the predicted cTP of 802 rice proteins representing the best homologues for 898 annotated Arabidopsis chloroplast proteins, but only those proteins (714) were used with a predicted cTP length of at least 25 aa residues.
Figure 7
Figure 7. Chloroplast transit peptide analysis of Arabidopsis chloroplast proteins and predicted rice homologues.
Sequence logos of the first 20 N-terminal residues (A,C) and aa distribution and frequency across the normalized (binned) cTP length (B,D) for 898 annotated Arabidopsis chloroplast proteins (A,B) and the 802 predicted rice homologues (C,D). Only those proteins were used with a predicted cTP length of at least 20 aa residues (831 and 714, respectively from Arabidopsis and rice).

References

    1. von Heijne G, Steppuhn J, Hermann SG. Domain structure of mitochondrial and chloroplast targeting peptides. Eur J Biochemistry. 1989;80:535–545. - PubMed
    1. Emanuelsson O, Brunak S, von Heijne G, Nielsen H. Locating proteins in the cell using TargetP, SignalP and related tools. Nat Protoc. 2007;2(4):953–971. - PubMed
    1. Richly E, Leister D. An improved prediction of chloroplast proteins reveals diversities and commonalities in the chloroplast proteomes of Arabidopsis and rice. Gene. 2004;329:11–16. - PubMed
    1. Sun Q, Emanuelsson O, van Wijk KJ. Analysis of curated and predicted plastid subproteomes of Arabidopsis. Subcellular compartmentalization leads to distinctive proteome properties. Plant Physiol. 2004;135(2):723–734. - PMC - PubMed
    1. van Wijk KJ. Plastid proteomics. Plant Physiol Biochem. 2004;42(12):963–77. - PubMed

Publication types