. 2008 Jun;11(6):713-20.
doi: 10.1038/nn.2116. Epub 2008 Apr 27.

Three-dimensional random access multiphoton microscopy for functional imaging of neuronal activity

Affiliations

Three-dimensional random access multiphoton microscopy for functional imaging of neuronal activity

Gaddum Duemani Reddy et al. Nat Neurosci. 2008 Jun.

Abstract

The dynamic ability of neuronal dendrites to shape and integrate synaptic responses is the hallmark of information processing in the brain. Effectively studying this phenomenon requires concurrent measurements at multiple sites on live neurons. Substantial progress has been made by optical imaging systems that combine confocal and multiphoton microscopy with inertia-free laser scanning. However, all of the systems developed so far restrict fast imaging to two dimensions. This severely limits the extent to which neurons can be studied, as they represent complex three-dimensional structures. Here we present a new imaging system that utilizes a unique arrangement of acousto-optic deflectors to steer a focused, ultra-fast laser beam to arbitrary locations in three-dimensional space without moving the objective lens. As we demonstrate, this highly versatile random-access multiphoton microscope supports functional imaging of complex three-dimensional cellular structures such as neuronal dendrites or neural populations at acquisition rates on the order of tens of kilohertz.


Figures

Figure 1
Figure 1. 2D versus 3D AOD Scanning
(a) 2D scanning: Left, angular deflection (θ(x,t)) of a collimated laser beam by a single AOD with a fixed frequency (f) acoustic wave. Right, two-point random-access lateral scan of an ultra-fast laser beam focused by an 10X objective lens into a cuvette containing fluorescein solution, resulting in two distinguishable focal spots in a single axial plane (inset, zoomed-in view). Bottom, fast scanning with 2 orthogonal AODs is restricted to a single plane. (b) 3D scanning: Left, change in collimation (focal length FAOL) and angular deflection (θ(x,t)) by counter-propagating chirped acoustic waves (f1, f2) in a pair of AODs. Right, two-point random-access axio-lateral scan, resulting in two distinguishable focal spots at different axial planes (inset, zoomed-in view). Bottom, 2 orthogonal pairs of AODs support fast scanning within a volume.
Figure 2
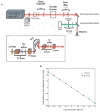
Figure 2. Optical Layout and Axial Scan Range
(a) Imaging system containing an ultrafast pulsed laser (Ti:S Mira HP), pulse diagnostic devices (Spectrum Analyzer, Autocorrelator), beam shaping optics (Beam Expander, Scan Magnification), the 3D AOD Scanner (see inset), an upright epifluorescence microscope (Dichroic Mirrors, Objective Lens), and the detection unit (Demagnification, Emission Filter, PMT). Inset, 3D AOD Scanner consisting of polarization control (λ/2 Plate) and 4 AODs with relay telescopes (Scan X1,2, Y1,2 AODs). Not shown, located above the short pass dichroic mirror, an infrared-sensitive camera, used for transillumination visualization of the specimen during patching. (b) Predicted (solid line) and measured (crosses) axial distance of the focal position from the inherent focal plane of the objective lens.
Figure 3
Figure 3. Structural Imaging with Different 3D Scanning Modes
(a) Axial and lateral projections of a fluorescent bead (10μm diameter) imaged with combined 2D AOD lateral scanning and stepper motor axial positioning (“2+1D” mode), and with 3D AOD scanning (“3+0D” mode). (b) Axial projections (left) and selected optical sections (right) of a reconstructed pollen grain (~35μm size) imaged in both the 2+1D and the 3+0D mode (scale bars, 10μm).
Figure 4
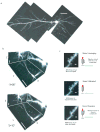
Figure 4. Structural Imaging of Neurons
(a) Axial projection of a neuron filled with a fluorescent label (Alexa 594), acquired in 3 separate image stacks using the 3+0D scanning mode (axial range, 50μm; scale bar, 50μm). (b) Full projections of single image stacks from another neuron, acquired in both the 3+0D and the 2+1D mode (XY scale bar, 50μm; ZY scale bar, 10μm). (c) Dendritic segment imaged in 3+0D mode with high resolution (zoom-in) at three different AOD-controlled focal distances. Middle, reference image, taken at inherent focal distance of the objective lens (reference plane). Test images, taken at AOD-controlled effective focal planes 25μm above (top) and 25μm below (bottom) the reference plane with the objective lens moved in the opposite direction to compensate (scale bars, 1μm).
Figure 5
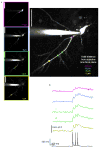
Figure 5. Functional Imaging of CA1 Pyramidal Neuron
(a) Functional imaging sites selected from a structural image acquired in 3+0D scanning mode. Left, individual optical sections (scale bars, 50μm); right, user-selected sites on maximum projection image (scale bar, 50μm). Axial distances from the inherent focal plane of the objective are color coded. (b) Random access imaging of calcium signals at the selected sites (top) during a train of bAPs (bottom). Acquisition rate ~10kHz.
Figure 6
Figure 6. Fast 3D Monitoring of Dendritic Calcium Dynamics
(a) 3D functional image (using a random access scan) of calcium transients along oblique dendrites during a train of three bAPs (n = 5; scale bar 50μm). Acquisition rate ~3kHz. (b) 3D functional image (using a random access scan) of a portion of an apical dendrite, (n = 5; scale bar 25μm). Acquisition rate ~5kHz. Inset, 3D reconstruction. Red and green lines indicate sites that are not easily distinguishable on the maximum projection image since they are located above a brighter dendritic segment. (c) 3D functional image (using a random access scan) of a zoomed-in portion of an oblique dendrite demonstrating calcium transients in the dendrite as well as in a spine (circled; n=5; scale bar 2μm). Acquisition rate ~3kHz. For all images, axial distances of the user-selected sites are color coded (measured in microns relative to the inherent objective lens focus). All values rounded to nearest micron.

References

    1. Megias M, Emri Z, Freund TF, Gulyas AI. Total number and distribution of inhibitory and excitatory synapses on hippocampal CA1 pyramidal cells. Neuroscience. 2001;102:527–540. - PubMed
    1. Ambros-Ingerson J, Holmes WR. Analysis and comparison of morphological reconstructions of hippocampal field CA1 pyramidal cells. Hippocampus. 2005;15:302–315. - PubMed
    1. Losonczy A, Magee JC. Integrative properties of radial oblique dendrites in hippocampal CA1 pyramidal neurons. Neuron. 2006;50:291–307. - PubMed
    1. Frick A, Magee J, Koester HJ, Migliore M, Johnston D. Normalization of Ca2+ signals by small oblique dendrites of CA1 pyramidal neurons. J Neurosci. 2003;23:3243–3250. - PMC - PubMed
    1. Helmchen F, Svoboda K, Denk W, Tank DW. In vivo dendritic calcium dynamics in deep-layer cortical pyramidal neurons. Nat Neurosci. 1999;2:989–996. - PubMed

Publication types