

An extensive (co-)expression analysis tool for the cytochrome P450 superfamily in Arabidopsis thaliana
- PMID: 18433503
- PMCID: PMC2383897
- DOI: 10.1186/1471-2229-8-47
An extensive (co-)expression analysis tool for the cytochrome P450 superfamily in Arabidopsis thaliana
Abstract
Background: Sequencing of the first plant genomes has revealed that cytochromes P450 have evolved to become the largest family of enzymes in secondary metabolism. The proportion of P450 enzymes with characterized biochemical function(s) is however very small. If P450 diversification mirrors evolution of chemical diversity, this points to an unexpectedly poor understanding of plant metabolism. We assumed that extensive analysis of gene expression might guide towards the function of P450 enzymes, and highlight overlooked aspects of plant metabolism.
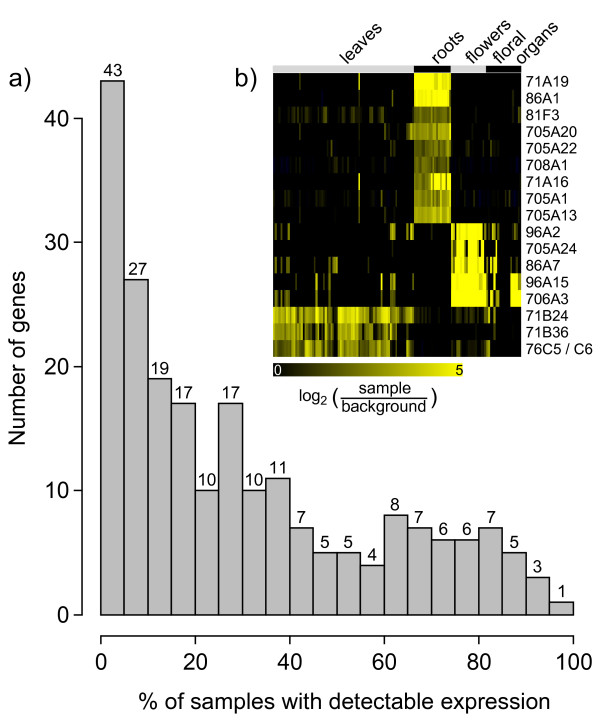
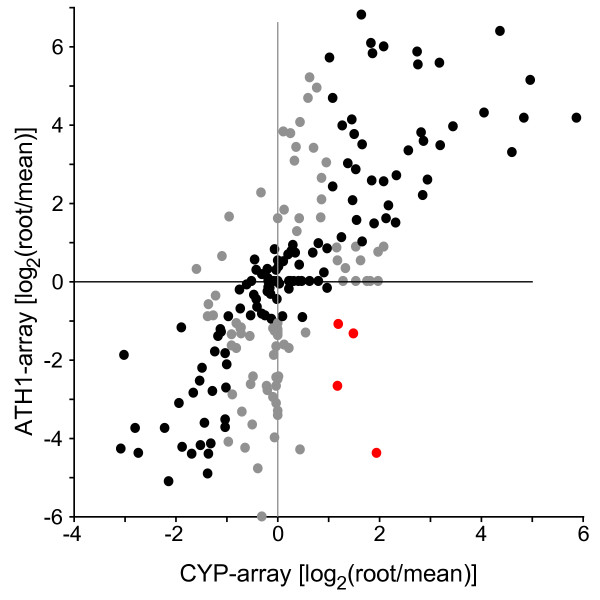
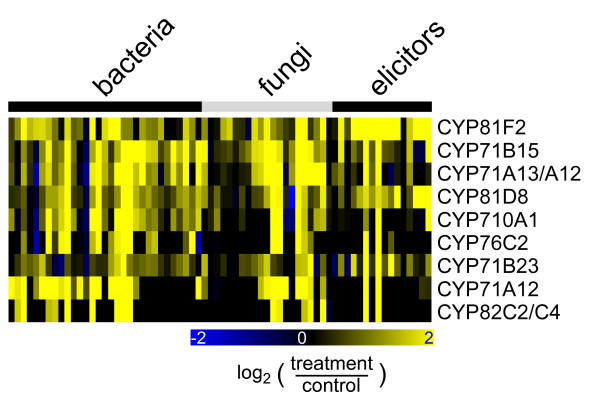
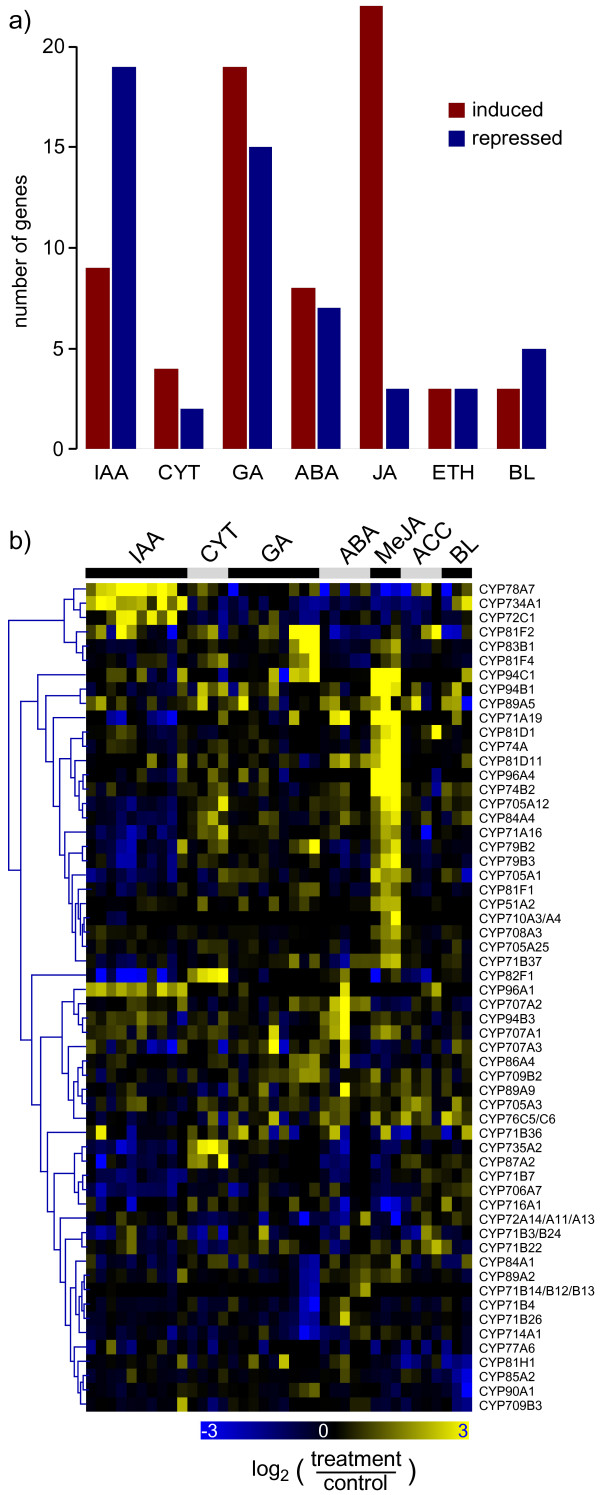
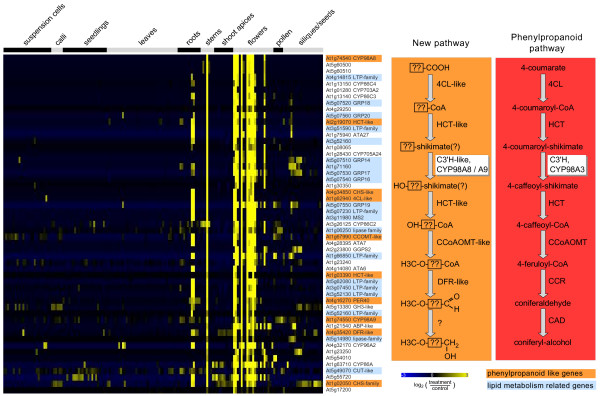
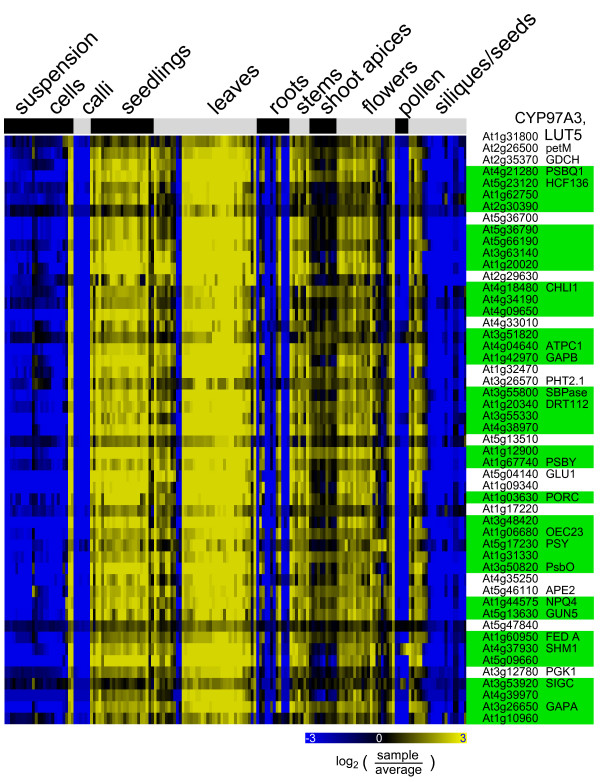
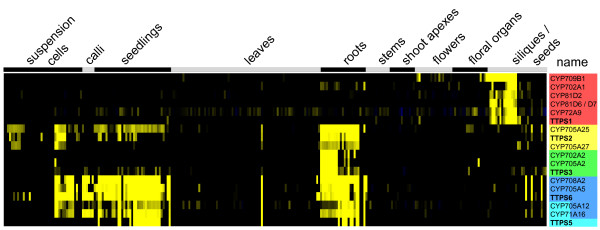
Results: We have created a comprehensive database, 'CYPedia', describing P450 gene expression in four data sets: organs and tissues, stress response, hormone response, and mutants of Arabidopsis thaliana, based on public Affymetrix ATH1 microarray expression data. P450 expression was then combined with the expression of 4,130 re-annotated genes, predicted to act in plant metabolism, for co-expression analyses. Based on the annotation of co-expressed genes from diverse pathway annotation databases, co-expressed pathways were identified. Predictions were validated for most P450s with known functions. As examples, co-expression results for P450s related to plastidial functions/photosynthesis, and to phenylpropanoid, triterpenoid and jasmonate metabolism are highlighted here.
Conclusion: The large scale hypothesis generation tools presented here provide leads to new pathways, unexpected functions, and regulatory networks for many P450s in plant metabolism. These can now be exploited by the community to validate the proposed functions experimentally using reverse genetics, biochemistry, and metabolic profiling.
Figures
Similar articles
-
Whole genome co-expression analysis of soybean cytochrome P450 genes identifies nodulation-specific P450 monooxygenases.BMC Plant Biol. 2010 Nov 9;10:243. doi: 10.1186/1471-2229-10-243. BMC Plant Biol. 2010. PMID: 21062474 Free PMC article.
-
Functional annotation of the Arabidopsis P450 superfamily based on large-scale co-expression analysis.Biochem Soc Trans. 2006 Dec;34(Pt 6):1192-8. doi: 10.1042/BST0341192. Biochem Soc Trans. 2006. PMID: 17073783
-
CYP709B3, a cytochrome P450 monooxygenase gene involved in salt tolerance in Arabidopsis thaliana.BMC Plant Biol. 2013 Oct 28;13:169. doi: 10.1186/1471-2229-13-169. BMC Plant Biol. 2013. PMID: 24164720 Free PMC article.
-
Jasmonate biosynthesis in Arabidopsis thaliana--enzymes, products, regulation.Plant Biol (Stuttg). 2006 May;8(3):297-306. doi: 10.1055/s-2006-923935. Plant Biol (Stuttg). 2006. PMID: 16807821 Review.
-
Diversification of P450 genes during land plant evolution.Annu Rev Plant Biol. 2010;61:291-315. doi: 10.1146/annurev-arplant-042809-112305. Annu Rev Plant Biol. 2010. PMID: 20192745 Review.
Cited by
-
Cytochrome P450 CYP89A9 is involved in the formation of major chlorophyll catabolites during leaf senescence in Arabidopsis.Plant Cell. 2013 May;25(5):1868-80. doi: 10.1105/tpc.113.112151. Epub 2013 May 30. Plant Cell. 2013. PMID: 23723324 Free PMC article.
-
Nonsterol Triterpenoids as Major Constituents of Olea europaea.J Lipids. 2012;2012:476595. doi: 10.1155/2012/476595. Epub 2012 Mar 20. J Lipids. 2012. PMID: 22523691 Free PMC article.
-
Genome-wide comparison of two poplar genotypes with different growth rates.Plant Mol Biol. 2011 Aug;76(6):575-91. doi: 10.1007/s11103-011-9790-0. Epub 2011 May 26. Plant Mol Biol. 2011. PMID: 21614644
-
Identification of Differentially Expressed Genes by cDNA-AFLP Technique in Response to Drought Stress in Triticum durum.Food Technol Biotechnol. 2014 Dec;52(4):479-488. doi: 10.17113/ftb.52.04.14.3701. Food Technol Biotechnol. 2014. PMID: 27904321 Free PMC article.
-
Formation of plant metabolic gene clusters within dynamic chromosomal regions.Proc Natl Acad Sci U S A. 2011 Sep 20;108(38):16116-21. doi: 10.1073/pnas.1109273108. Epub 2011 Aug 29. Proc Natl Acad Sci U S A. 2011. PMID: 21876149 Free PMC article.
References
-
- Nelson D. Plant cytochrome P450s from moss to poplar. Phytochem Rev. 2006;5:193–204. doi: 10.1007/s11101-006-9015-3. - DOI
-
- Schuler M, Duan H, Bilgin M, Ali S. Arabidopsis cytochrome P450s through the looking glass: a window on plant biochemistry. Phytochem Rev. 2006;5:205–237. doi: 10.1007/s11101-006-9035-z. - DOI
-
- Werck-Reichhart D. Cytochromes P450. In: Somerville C and Meyerowitz E, editor. The Arabidopsis book. Rockville MD, American Society of Plant Biologists, Rockville, MD; 2002. http://www.bioone.org/perlserv/?request=get-document&issn=1543-8120&volu...
Publication types
MeSH terms
Substances
LinkOut - more resources
Full Text Sources
Other Literature Sources
Molecular Biology Databases
Research Materials
