. 2008 Oct;1778(10):2032-40.
doi: 10.1016/j.bbamem.2008.03.019. Epub 2008 Apr 3.

Molecular weight dependence of the depletion attraction and its effects on the competitive adsorption of lung surfactant

Affiliations

Molecular weight dependence of the depletion attraction and its effects on the competitive adsorption of lung surfactant

Patrick C Stenger et al. Biochim Biophys Acta. 2008 Oct.

Abstract

Albumin competes with lung surfactant for the air-water interface, resulting in decreased surfactant adsorption and increased surface tension. Polyethylene glycol (PEG) and other hydrophilic polymers restore the normal rate of surfactant adsorption to the interface, which re-establishes low surface tensions on compression. PEG does so by generating an entropic depletion attraction between the surfactant aggregates and interface, reducing the energy barrier to adsorption imposed by the albumin. For a fixed composition of 10 g/L (1% wt.), surfactant adsorption increases with the 0.1 power of PEG molecular weight from 6 kDa-35 kDa as predicted by simple excluded volume models of the depletion attraction. The range of the depletion attraction for PEG with a molecular weight below 6 kDa is less than the dimensions of albumin and there is no effect on surfactant adsorption. PEG greater than 35 kDa reaches the overlap concentration at 1% wt. resulting in both decreased depletion attraction and decreased surfactant adsorption. Fluorescence images reveal that the depletion attraction causes the surfactant to break through the albumin film at the air-water interface to spread as a monolayer. During this transition, there is a coexistence of immiscible albumin and surfactant domains. Surface pressures well above the normal equilibrium surface pressure of albumin are necessary to force the albumin from the interface during film compression.


Figures

Figure 1
Figure 1
Cyclic isotherms of Survanta on buffered saline subphase containing albumin and/or polymer. (a) 800 μg Survanta on a clean buffered saline subphase (no albumin or polymer). On compression, the isotherm exhibits a characteristic shoulder at 40 mN/m. The collapse plateau at Πmax ∼ 65 mN/m determines the maximum surface pressure (minimum surface tension) possible for a given surfactant. On expansion, the surface pressure immediately drops to 10 mN/m; lung surfactant isotherms exhibit significant hysteresis between the compression and expansion parts of the cycle as collapsed material re-adsorbs at lower surface pressures [12]. (b) Black curve: 800 μg Survanta deposited onto a saline buffer subphase containing 2 mg/mL albumin and 1% wt. 1.45 kDa PEG. The characteristic shoulder and collapse plateau on compression seen in (a) cannot be reached with albumin in the subphase, despite the presence of low molecular weight PEG. Red Curve: The isotherm for the albumin subphase, with no Survanta or PEG. The two curves trace over each other, indicating that the interfacial film is dominated by albumin and the surfactant has been prevented from reaching the surface as shown in the fluorescence image, Fig. 2b. (c) 800 μg Survanta on saline buffer containing 2 mg/mL albumin and 1% wt. 10 kDa PEG. The characteristic shoulder and collapse plateau have been restored at similar trough areas as (a) with little change in surface pressure showing that the presence of 10 kDa PEG completely reverses the surfactant adsorption inhibition. The only difference is that the expansion cycle in Fig. 1c has a minimum surface pressure that is about 15-20 mN/m (vs. 5-10mN/m in Fig. 1a) which is a result of enhanced surfactant adsorption during the expansion due to 10 kDa PEG. Compression cycles are labeled 1-4 in chronological order. (d) 800 μg Survanta on saline buffer containing 2 mg/mL albumin and 1% wt. 200 kDa PEG. In this case, the characteristic shoulder and collapse plateau of (a) are obtained at higher trough compression indicating that 1% wt. 200 kDa PEG partially reverses the adsorption inhibition. Compression cycles are labeled 1-4 in chronological order.
Figure 2
Figure 2
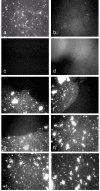
Fluorescence images of 800 μg Survanta spread at varying subphase compositions. Images are 1023 μm by 789 μm. (a) Survanta on a clean, buffered subphase at Π = 43 mN/m during compression. The image shows the mottled texture typical of a phase separated lipid/protein monolayer. The bright spots are Survanta aggregates partially adsorbed to the interface and partially in solution. (b) Survanta on a subphase containing 2 mg/mL albumin at Π = 25 mN/m during compression. The weak out of focus fluorescence on a black background shows that Survanta aggregates come close to the interface, but cannot spread due to the albumin film at the interface. The remaining images show Survanta on a subphase containing 2 mg/mL albumin and 1% wt. 200 kDa PEG in successive compression/expansion cycles. Real time fluorescence movies of the isotherms are available in the supplementary materials. Row 2-First Cycle (c) Π = 18 mN/m during compression. At low surface pressure, no fluorescence is visible showing that the albumin prevents Survanta from adsorbing to the interface. (d) Π = 38 mN/m during compression. Similar to (b), Survanta (out of focus bright spots) cannot break through the albumin film even at a surface pressure well above the equilibrium spreading pressure of albumin (∼ 20 mN/m). Row 3-Second Cycle (e) Π = 18 mN/m during compression. Survanta breaks through the albumin film; extended (>1000 μm) immiscible Survanta (mottled grey) and albumin (black) domains coexist on the interface. (f) Π = 16 mN/m during expansion. The Survanta and albumin coexistence persists as the second cycle Πmax (∼ 55 mN/m) is not sufficient to squeeze out all of the albumin. Row 4-Third Cycle (g) Π = 26 mN/m during compression. Albumin domains exist at low surface pressure but are squeezed out at high surface pressure (Third cycle Πmax ∼ 65 mN/m). (h) Π = 15 mN/m during expansion. From the third expansion onward, only Survanta is observed in the film. Row 5-Fourth Cycle (i) Π = 43 mN/m during compression. The mottled texture of the film is similar to Survanta (a) however the bright domains are significantly larger in (h-j) due to the PEG induced depletion attraction leading to the flocculation and growth of the Survanta aggregates. (j) Π = 68 mN/m during compression. The film reaches a collapse pressure similar to Fig. 1a.
Figure 3
Figure 3
Fourth cycle compression isotherms of (a) varying concentrations of Survanta on a clean buffered subphase and (b) 800 μg Survanta on a saline buffered subphase containing 2 mg/mL albumin and 1% wt. PEG of varying molecular weights. (a)▽ 3 μg Survanta; △ 8 μg Survanta; ⎔ 30 μg Survanta; ◇ 80 μg Survanta; ○ 300 μg Survanta; □ 800 μg Survanta; At a given surface pressure, the isotherms are translated unchanged from low trough area to high trough area with increasing Survanta concentration (note the characteristic shoulder at ∼ 40 mN/m and the collapse plateau at ∼ 65 mN/m). The interface becomes saturated for concentrations greater than about 300 μg; the 800 μg isotherm is not displaced significantly to higher trough areas. Increasing surfactant adsorption to the interface leads to this gradual shift of the isotherms from left to right. (b) □ Survanta only; ○ Survanta-albumin; △ Survanta-albumin-PEG 1.45 kDa; ▽ Survanta-albumin-PEG 3.35 kDa; ◁ Survanta-albumin-PEG 6 kDa; ◇ Survanta-albumin-PEG 35 kDa; ⎔ Survanta-albumin-PEG 100 kDa. Except for PEG 1.45 kDa, the presence of 1% wt. PEG in the subphase shifts the isotherms to higher trough areas, the same effect as increasing the Survanta concentration in (a). For readability, 10 kDa and 20 kDa curves were omitted as they nearly overlap with 35 kDa; 200 kDa was similarly omitted as it overlapped with 100 kDa. Cumulative results from all experiments are presented in Fig. 4. The shaded area denotes the trough area over which the surface pressure was averaged for each PEG molecular weight to obtain the relative surfactant adsorption plotted in Fig. 4.
Figure 4
Figure 4
Relative adsorption (RA) of 800 μg Survanta on subphases containing 2 mg/mL albumin at varying PEG molecular weights and concentrations. ○ 1% wt. PEG; □ 0.5% wt. PEG; △ 0% wt. PEG which has been plotted for comparison purposes. RA is the difference between the sample surface pressure (Π) and the surface pressure of the albumin only isotherm (ΠAlb, red curve in Fig. 1b), divided by the difference between the surface pressure for the saturated isotherm (ΠSat, > 1% PEG 10 kDa [13]) and ΠAlb, RA=ΠΠAlbΠSatΠAlbA0. All surface pressures were evaluated by averaging over the same trough area, A0, denoted by the shaded area in Figure 3b. Region I (PEG 1.45 - 3.35 kDa) corresponds to minimal reversal of surfactant adsorption inhibition, Region II (PEG 6 - 35 kDa) corresponds to complete reversal of adsorption inhibition and Region III (PEG 100 - 200 kDa) corresponds to partial reversal of adsorption inhibition. The dashed line, where RA depends on the MW0.1 as predicted by Eqns. 1-5, is a good fit to the PEG 1% wt. data in Region II, consistent with the depletion attraction lowering the energy barrier to surfactant adsorption. Data points were offset vertically (maximum 5%) to enhance graph readability.

References

    1. Clements JA, Avery ME. American Journal of Respiratory and Critical Care Medicine. 1998;157:S59–S66. - PubMed
    1. Notter R. Lung surfactant: basic science and clinical applications. Vol. 149. Marcel Dekker; New York: 2000.
    1. Rubenfeld GD, Caldwell E, Peabody E, Weaver J, Martin DP, Neff M, Stern EJ, Hudson LD. New England Journal of Medicine. 2005;353:1685–1693. - PubMed
    1. Kesecioglu J, Haitsma JJ. Current Opinion in Critical Care. 2006;12:55–60. - PubMed
    1. Tashiro K, Cui XG, Kobayashi T, Curstedt T, Robertson B. Biology of the Neonate. 2003;83:49–56. - PubMed

Publication types

LinkOut - more resources