

Fewer active motors per vesicle may explain slowed vesicle transport in chick motoneurons after three days in vitro
- PMID: 18433736
- PMCID: PMC2464625
- DOI: 10.1016/j.brainres.2008.03.014
Fewer active motors per vesicle may explain slowed vesicle transport in chick motoneurons after three days in vitro
Abstract
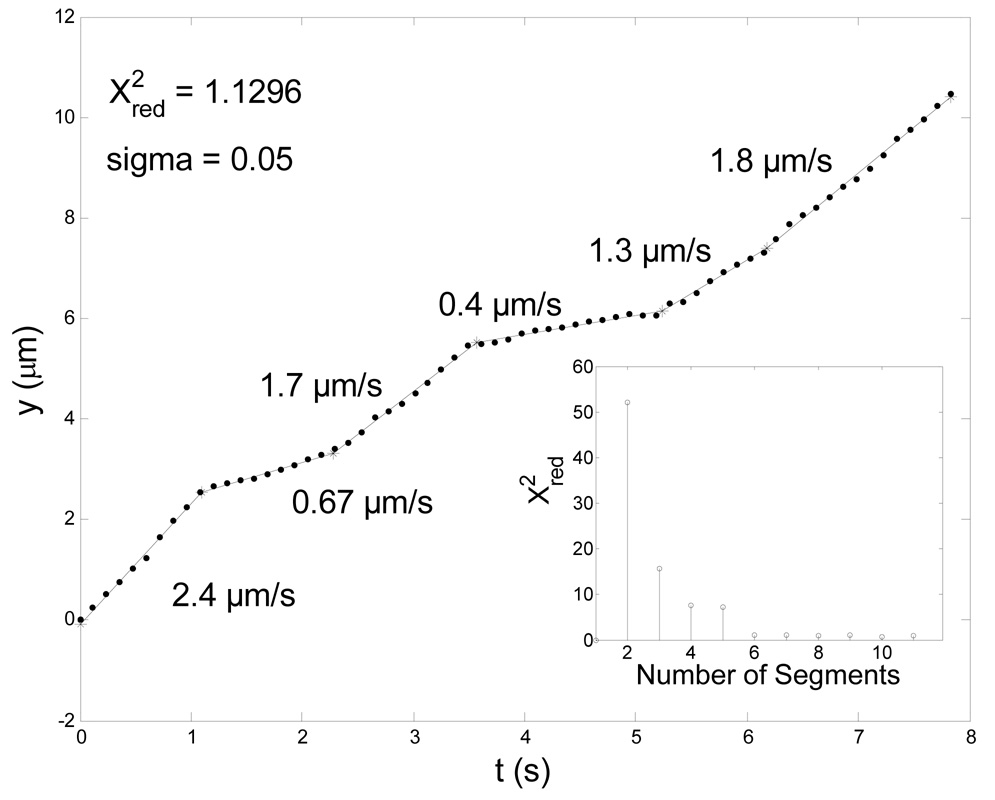
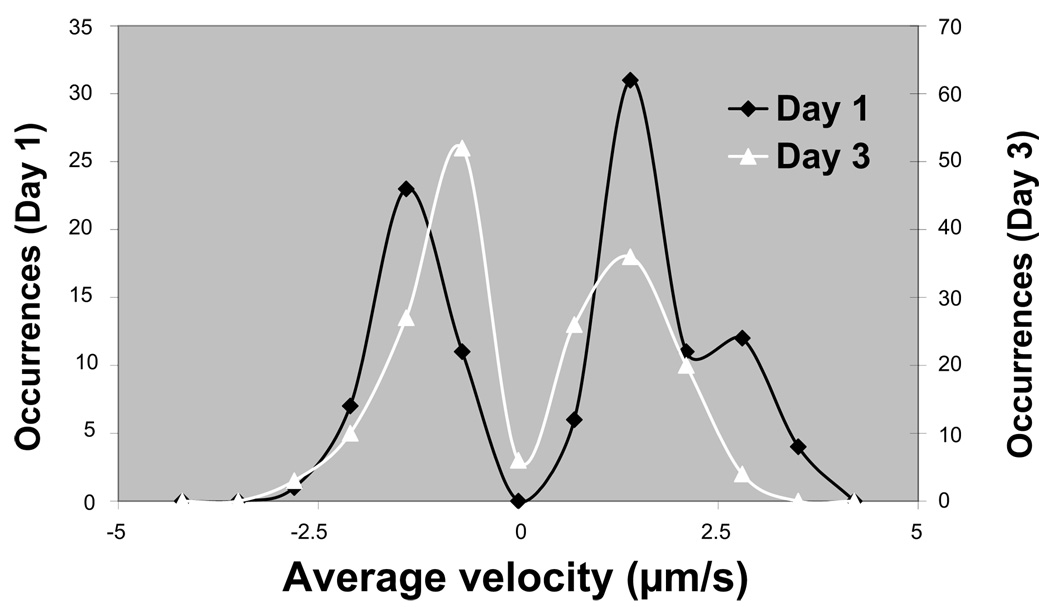
Vesicle transport in cultured chick motoneurons was studied over a period of 3 days using motion-enhanced differential interference contrast (MEDIC) microscopy, an improved version of video-enhanced DIC. After 3 days in vitro (DIV), the average vesicle velocity was about 30% less than after 1 DIV. In observations at 1, 2 and 3 DIV, larger vesicles moved more slowly than small vesicles, and retrograde vesicles were larger than anterograde vesicles. The number of retrograde vesicles increased relative to anterograde vesicles after 3 DIV, but this fact alone could not explain the decrease in velocity, since the slowing of vesicle transport in maturing motoneurons was observed independently for both anterograde and retrograde vesicles. In order to better understand the slowing trend, the distance vs. time trajectories of individual vesicles were examined at a frame rate of 8.3/s. Qualitatively, these trajectories consisted of short (1-2 s) segments of constant velocity, and the changes in velocity between segments were abrupt (<0.2 s). The trajectories were therefore fit to a series of connected straight lines. Surprisingly, the slopes of theses lines, i.e. the vesicle velocities, were often found to be multiples of ~0.6 mum/s. The velocity histogram showed multiple peaks, which, when fit with Gaussians using a least squares minimization, yielded an average spacing of 0.57 mum/s (taken as the slope of a fit to peak position vs. peak number, R(2)=0.994). We propose that the abrupt velocity changes occur when 1 or 2 motors suddenly begin or cease actively participating in vesicle transport. Under this hypothesis, the decrease in average vesicle velocity observed for maturing motoneurons is due to a decrease in the average number of active motors per vesicle.
Figures


Similar articles
-
Anterograde glycoprotein-dependent transport of newly generated rabies virus in dorsal root ganglion neurons.J Virol. 2014 Dec;88(24):14172-83. doi: 10.1128/JVI.02254-14. Epub 2014 Oct 1. J Virol. 2014. PMID: 25275124 Free PMC article.
-
Fast vesicle transport in PC12 neurites: velocities and forces.Eur Biophys J. 2004 Nov;33(7):623-32. doi: 10.1007/s00249-004-0403-6. Epub 2004 Apr 8. Eur Biophys J. 2004. PMID: 15071760
-
Transformation of synaptic vesicle phenotype in the intramedullary axonal arbors of cat spinal motoneurons following peripheral nerve injury.Exp Brain Res. 2001 Aug;139(3):297-302. doi: 10.1007/s002210100766. Exp Brain Res. 2001. PMID: 11545468
-
Development of spinal motor networks in the chick embryo.J Exp Zool. 1992 Mar 1;261(3):261-73. doi: 10.1002/jez.1402610306. J Exp Zool. 1992. PMID: 1629659 Review.
-
Axonal transport and the delivery of pre-synaptic components.Curr Opin Neurobiol. 2008 Oct;18(5):495-503. doi: 10.1016/j.conb.2008.10.003. Epub 2008 Oct 27. Curr Opin Neurobiol. 2008. PMID: 18950710 Free PMC article. Review.
Cited by
-
Force-velocity curves of motor proteins cooperating in vivo.Cell Biochem Biophys. 2008;52(1):19-29. doi: 10.1007/s12013-008-9021-8. Cell Biochem Biophys. 2008. PMID: 18696014 Free PMC article.
-
Dynamics of peptidergic secretory granule transport are regulated by neuronal stimulation.BMC Neurosci. 2010 Mar 4;11:32. doi: 10.1186/1471-2202-11-32. BMC Neurosci. 2010. PMID: 20202202 Free PMC article.
-
Intraneuronal vesicular organelle transport changes with cell population density in vitro.Neurosci Lett. 2008 Aug 22;441(2):173-7. doi: 10.1016/j.neulet.2008.06.026. Epub 2008 Jun 13. Neurosci Lett. 2008. PMID: 18603370 Free PMC article.
-
Bidirectional transport by molecular motors: enhanced processivity and response to external forces.Biophys J. 2010 Jun 2;98(11):2610-8. doi: 10.1016/j.bpj.2010.02.037. Biophys J. 2010. PMID: 20513405 Free PMC article.
-
Motion-enhanced, differential interference contrast (MEDIC) microscopy of moving vesicles in live cells: VE-DIC updated.J Microsc. 2008 Sep;231(3):433-9. doi: 10.1111/j.1365-2818.2008.02054.x. J Microsc. 2008. PMID: 18754997 Free PMC article.
References
-
- Allen RD. New observations on cell architecture and dynamics by video-enhanced contrast optical microscopy. Annu Rev Biophys Biophys Chem. 1985;14:265–290. - PubMed
-
- Allen RD, Allen NS. Video-enhanced microscopy with a computer frame memory. J Microsc. 1983;129(Pt 1):3–17. - PubMed
-
- Allen RD, Allen NS, Travis JL. Video-Enhanced Contrast, Differential Interference Contrast Microscopy. Cell Motility. 1981;1:291–302. - PubMed
-
- Block SM. Kinesin: what gives? Cell. 1998;93(1):5–8. - PubMed
Publication types
MeSH terms
Grants and funding
LinkOut - more resources
Full Text Sources
