. 2008 May 16;378(5):1155-73.
doi: 10.1016/j.jmb.2008.03.010. Epub 2008 Mar 14.

Molecular dynamics simulation of the Escherichia coli NikR protein: equilibrium conformational fluctuations reveal interdomain allosteric communication pathways

Affiliations

Molecular dynamics simulation of the Escherichia coli NikR protein: equilibrium conformational fluctuations reveal interdomain allosteric communication pathways

Michael J Bradley et al. J Mol Biol. .

Abstract

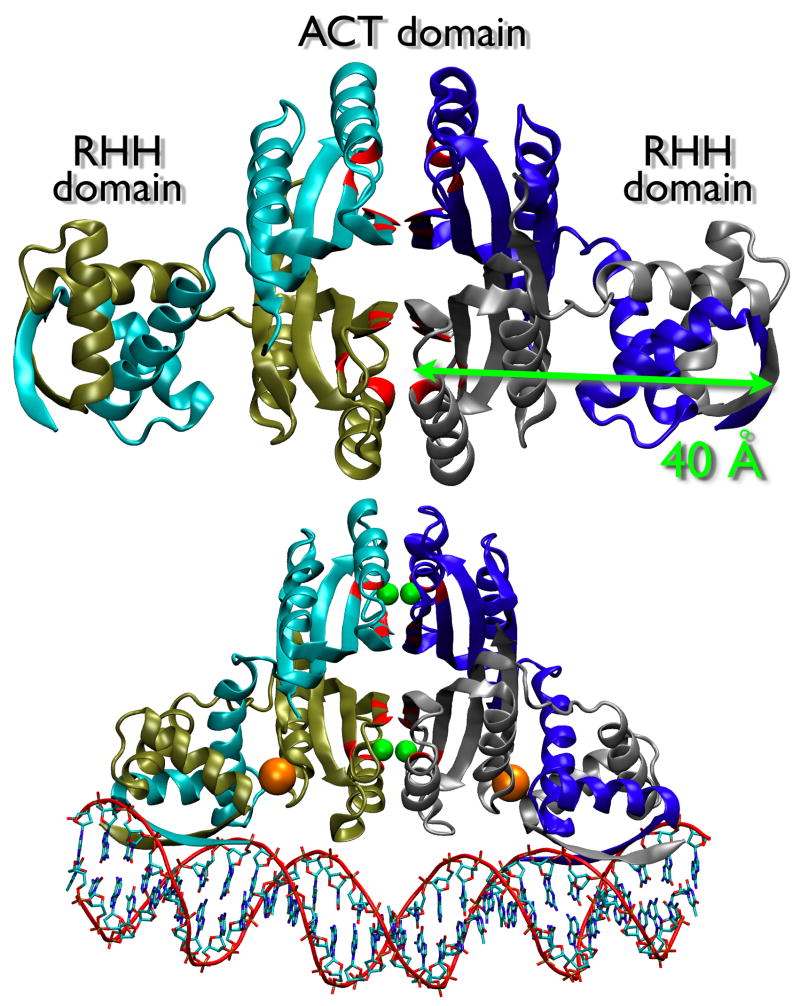
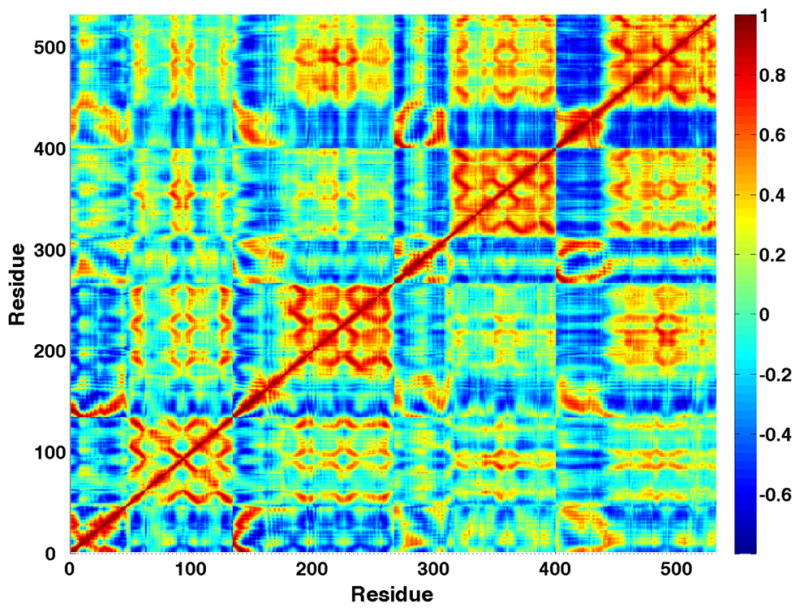
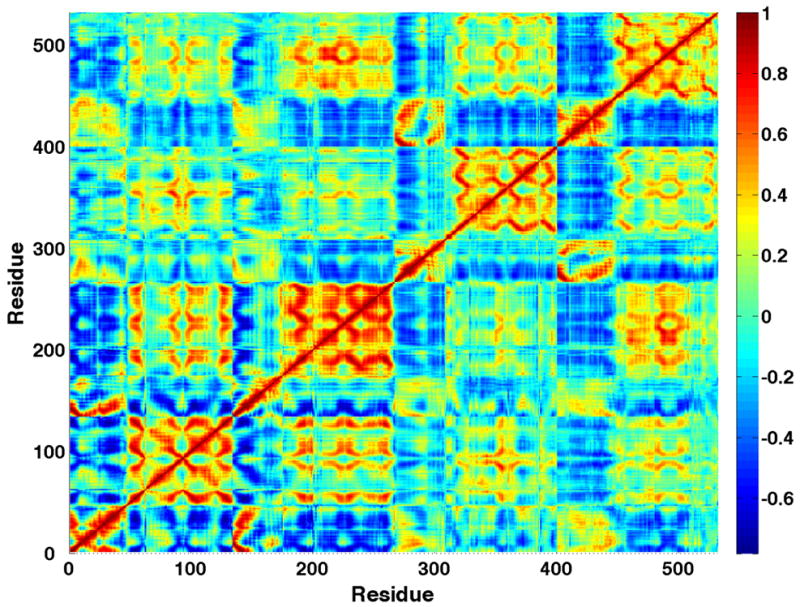
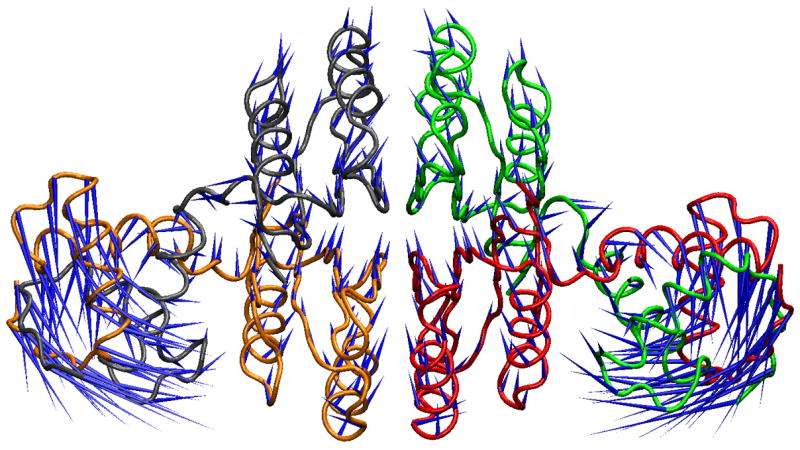
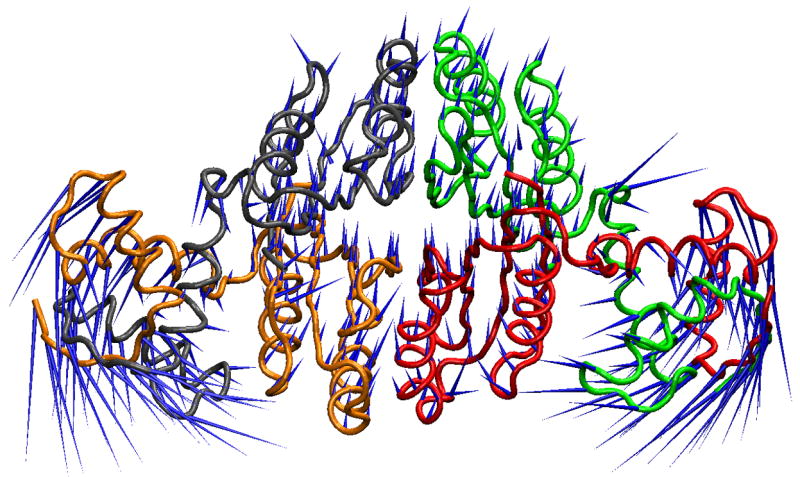
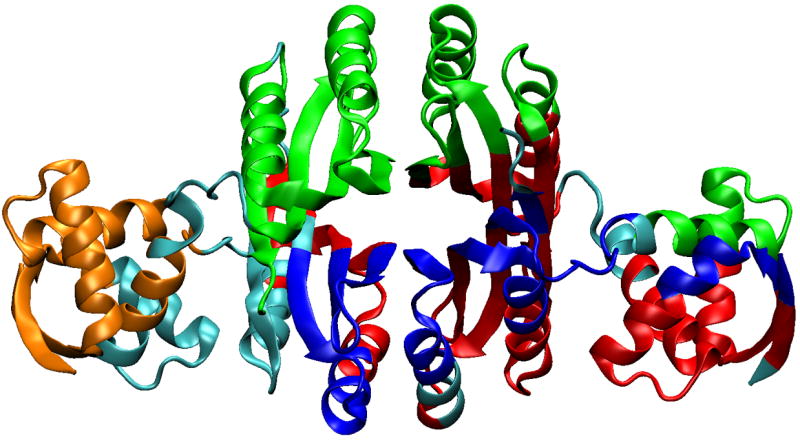
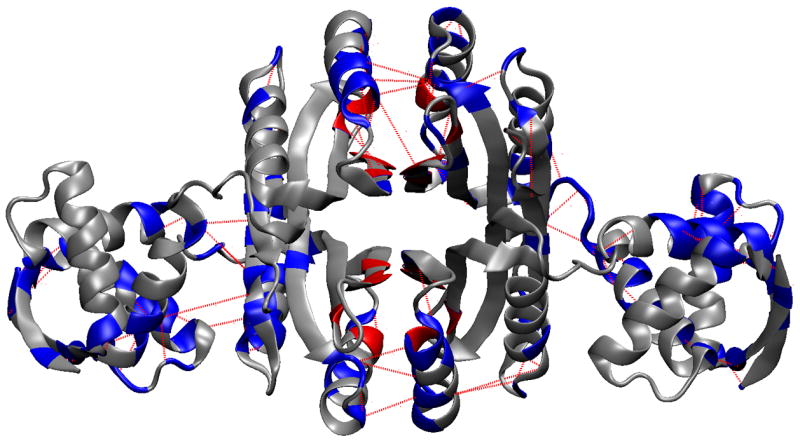
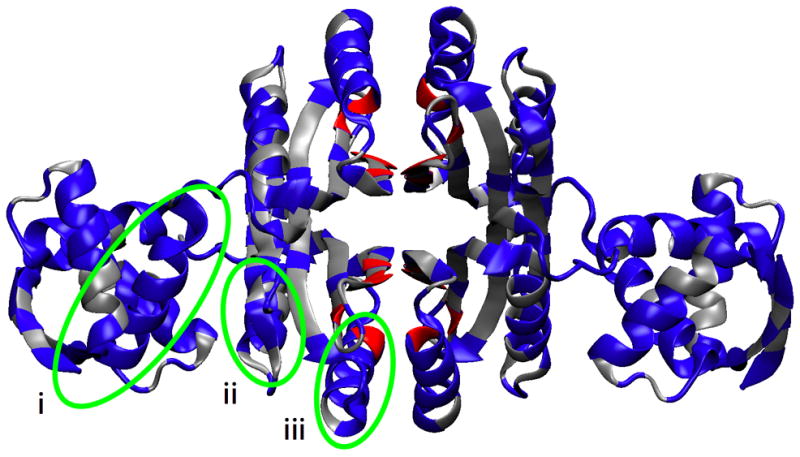
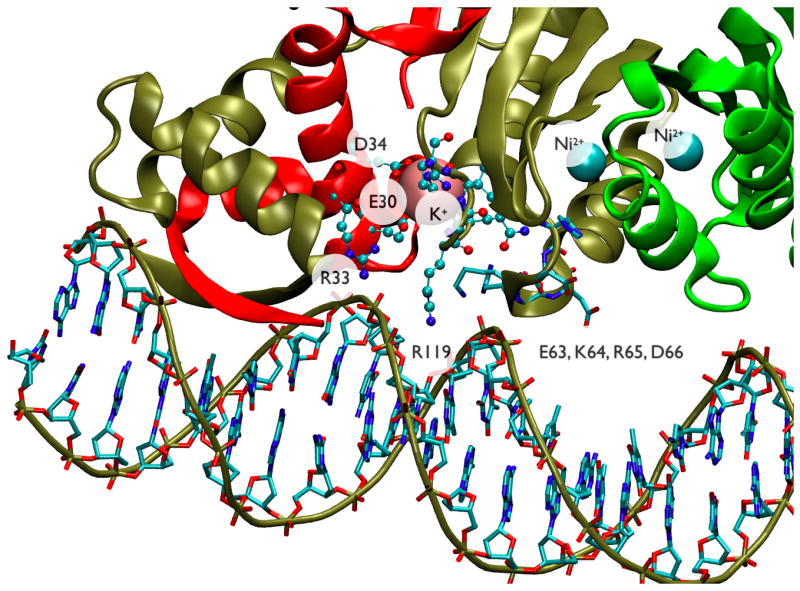
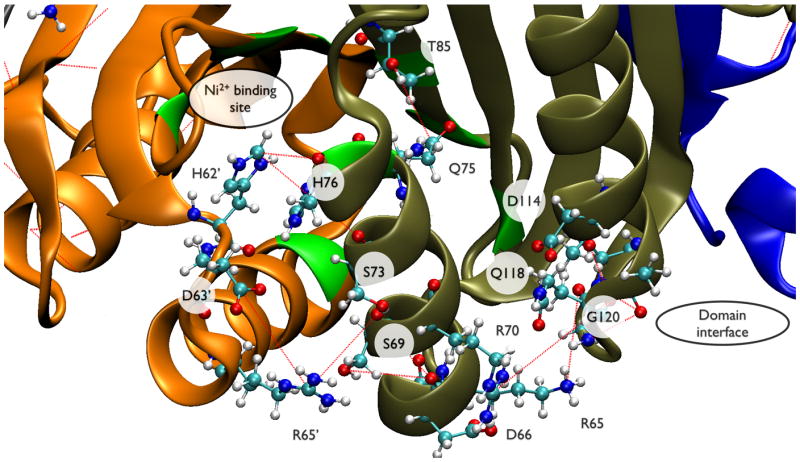
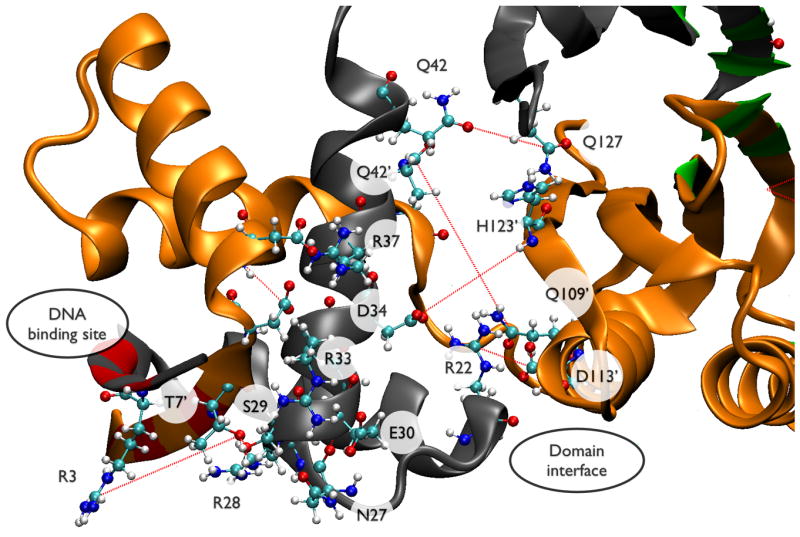
Escherichia coli NikR is a homotetrameric Ni(2+)- and DNA-binding protein that functions as a transcriptional repressor of the NikABCDE nickel permease. The protein is composed of two distinct domains. The N-terminal 50 amino acids of each chain forms part of the dimeric ribbon-helix-helix (RHH) domains, a well-studied DNA-binding fold. The 83-residue C-terminal nickel-binding domain forms an ACT (aspartokinase, chorismate mutase, and TyrA) fold and contains the tetrameric interface. In this study, we have utilized an equilibrium molecular dynamics simulation in order to explore the conformational dynamics of the NikR tetramer and determine important residue interactions within and between the RHH and ACT domains to gain insight into the effects of Ni(2+) on DNA-binding activity. The molecular simulation data were analyzed using two different correlation measures based on fluctuations in atomic position and noncovalent contacts together with a clustering algorithm to define groups of residues with similar correlation patterns for both types of correlation measure. Based on these analyses, we have defined a series of residue interrelationships that describe an allosteric communication pathway between the Ni(2+)- and DNA-binding sites, which are separated by 40 A. Several of the residues identified by our analyses have been previously shown experimentally to be important for NikR function. An additional subset of the identified residues structurally connects the experimentally implicated residues and may help coordinate the allosteric communication between the ACT and RHH domains.


Figures

Figure 1
Figure 1
Comparison of apo and Ni2+DNA-bound NikR x-ray crystal structures. Apo structure was generated from PDB ID 1Q5V with missing atoms built in and energy minimized. Ni2+DNA-bound NikR is from PDB ID 2HZV. Protein chains are in “new cartoon” rendering and colored cyan, blue, tan, and silver. Ni2+ binding site residue positions (His76, His87, His89, Cys95) are colored red. DNA double helix backbone is outlined in “tube” rendering and colored red while nucleotides are in “bond” rendering and colored by atom name. Ni2+ atoms are shown as green spheres. K+ atoms are shown as orange spheres. All molecular images generated using VMD 1.8.6 (Humphrey et al., 1996).
Figure 2
Figure 2
Cα correlation matrices. Last 71 ns (A) and last 51 ns (B). The data from the matrix that includes earlier non-equilibrated structural change has systematically larger (anti-)correlations within 2 of the 4 subunits. Figure generated using MATLAB 7.4 ((The MathWorks, Natick, MA, USA).
Figure 2
Figure 2
Cα correlation matrices. Last 71 ns (A) and last 51 ns (B). The data from the matrix that includes earlier non-equilibrated structural change has systematically larger (anti-)correlations within 2 of the 4 subunits. Figure generated using MATLAB 7.4 ((The MathWorks, Natick, MA, USA).
Figure 3
Figure 3
X-ray crystal structure and PCA mode displacement visualizations. A. The minimized starting structure is shown in tube representation colored by chain. The blue “porcupine needles” indicate the direction of displacement in going from the apo to the DNA-bound Ni2+NikR crystal structure, denoted as Δx in the text. B. The MD average structure from the last 51 ns is shown in tube representation colored by chain. The blue “porcupine needles” indicate the direction of displacement based upon the 2nd PCA mode, which has the highest overlap with Δx.
Figure 3
Figure 3
X-ray crystal structure and PCA mode displacement visualizations. A. The minimized starting structure is shown in tube representation colored by chain. The blue “porcupine needles” indicate the direction of displacement in going from the apo to the DNA-bound Ni2+NikR crystal structure, denoted as Δx in the text. B. The MD average structure from the last 51 ns is shown in tube representation colored by chain. The blue “porcupine needles” indicate the direction of displacement based upon the 2nd PCA mode, which has the highest overlap with Δx.
Figure 4
Figure 4
Residue clusters based on the correlation matrix. Clusters generated using the UPGMA algorithm were selected based on including either/both Ni2+ and DNA binding site residues. These clusters imply groups of residues with concerted conformational fluctuations that could be important for inter-domain communication. Different clusters are indicated by color, except cyan, which indicates residues not found in the selected clusters.
Figure 5
Figure 5
Protein regions identified by non-covalent contact correlations. A. Residues colored blue were selected using the UPGMA clustering criteria of finding the smallest clusters that include both Ni2+ and DNA binding site residues. The non-covalent contacts selected by this method are shown in red dashes. B. Color same as A, except residues are colored based on residue number irrespective of chain, thereby emphasizing the symmetry of the tetramer. The nickel binding residues are colored red (only His76, His87, and Cys95 were found in the UPGMA clusters). The remaining nickel binding residue, His89, is colored yellow. The three green ovals each highlight one example of the three regions with a concentration of correlated contacts: i. Helix B (residues 27–31, 33, 34, 37 to 48), ii. the end of helix D and turn leading into strand 5 (residues 117–123), iii. end of strand 2 and Helix C (residues 62–66 and 68–80).
Figure 5
Figure 5
Protein regions identified by non-covalent contact correlations. A. Residues colored blue were selected using the UPGMA clustering criteria of finding the smallest clusters that include both Ni2+ and DNA binding site residues. The non-covalent contacts selected by this method are shown in red dashes. B. Color same as A, except residues are colored based on residue number irrespective of chain, thereby emphasizing the symmetry of the tetramer. The nickel binding residues are colored red (only His76, His87, and Cys95 were found in the UPGMA clusters). The remaining nickel binding residue, His89, is colored yellow. The three green ovals each highlight one example of the three regions with a concentration of correlated contacts: i. Helix B (residues 27–31, 33, 34, 37 to 48), ii. the end of helix D and turn leading into strand 5 (residues 117–123), iii. end of strand 2 and Helix C (residues 62–66 and 68–80).
Figure 6
Figure 6
Close-up view of NikR-DNA interactions from the crystal structure (PDB ID 2HZV17). Protein chains are in “cartoon” rendering and colored red, tan, and green. Ni2+ atoms are shown as cyan spheres while K+ is shown in pink. The DNA backbone is outlined in “tube” rendering and colored tan while nucleotides are in “bond” rendering and colored by atom type. Protein side-chains for residues 63–66 are in “bond” rendering and colored by atom type while residues 30, 33, 34 and 118–122 are in “CPK” rendering and colored by atom type. The labeled protein residues correspond with the three groups identified in Figure 5 from MD analysis of apoNikR conformational dynamics. All three regions contain residues that make non-specific contacts with the DNA phosphate backbone. In addition the residues flanking R119 from one region along with residues E30 and D34 from another region form the cation-binding site that apparently helps stabilize the DNA-bound conformation.
Figure 7
Figure 7
This figure shows subsets of residues from Table 2 mapped onto the NikR structure: (A) residues that connect the Ni2+ binding site to the RHH/ACT interface and (B) the RHH domain and RHH/ACT interface. Individual protein chains are colored grey, orange, tan, and blue. Ni2+ binding residues are colored green; residues that make sequence-specific DNA contacts are colored red. Red dashes indicate correlated non-covalent contacts selected by UPGMA clustering (see Methods and Theory). Selected residues are shown in CPK rendering and labeled by residue type/number.
Figure 7
Figure 7
This figure shows subsets of residues from Table 2 mapped onto the NikR structure: (A) residues that connect the Ni2+ binding site to the RHH/ACT interface and (B) the RHH domain and RHH/ACT interface. Individual protein chains are colored grey, orange, tan, and blue. Ni2+ binding residues are colored green; residues that make sequence-specific DNA contacts are colored red. Red dashes indicate correlated non-covalent contacts selected by UPGMA clustering (see Methods and Theory). Selected residues are shown in CPK rendering and labeled by residue type/number.
Figure 8
Figure 8
Sequence logo for the NikR family. This logo represents a multiple sequence alignment containing 82 sequences, numbered according to the E. coli NikR sequence. For each position, the total height (in bits) of the residue letters indicates the degree of conservation at that position. Note that this sequence entropy measure of conservation is different from the method used for Table 2, which takes into account substitution matrices. This figure was generated using WebLogo.

Similar articles

Cited by

References

    1. Vignais PM, Billoud B, Meyer J. Classification and phylogeny of hydrogenases. FEMS Microbiol Rev. 2001;25:455–501. - PubMed
    1. Navarro C, Wu LF, Mandrand-Berthelot MA. The nik operon of Eschericia coli encodes a periplasmic binding-protein-dependent transport system for nickel. Mol Microbiol. 1993;9:1181–1191. - PubMed
    1. De Pina K, Desjardin V, Mandrand-Berthelot MA, Giordano G, Wu LF. Isolation and Characterization of the nikR Gene Encoding a Nickel-Responsive Regulator in Escherichia coli. J Bacteriol. 1999;181:670–4. - PMC - PubMed
    1. Chivers PT, Sauer RT. Regulation of high affinity nickel uptake in bacteria. Ni2+-Dependent interaction of NikR with wild-type and mutant operator sites. J Biol Chem. 2000;275:19735–41. - PubMed
    1. Iwig JS, Rowe JL, Chivers PT. Nickel homeostasis in Escherichia coli – the rcnR-rcnA efflux pathway and its linkage to NikR function. Molecular Microbiology. 2006;62:252–62. - PubMed

Publication types