. 2008 Jul 1;41(3):835-48.
doi: 10.1016/j.neuroimage.2008.02.052. Epub 2008 Mar 7.

Comparing surface-based and volume-based analyses of functional neuroimaging data in patients with schizophrenia

Affiliations

Comparing surface-based and volume-based analyses of functional neuroimaging data in patients with schizophrenia

Alan Anticevic et al. Neuroimage. .

Abstract

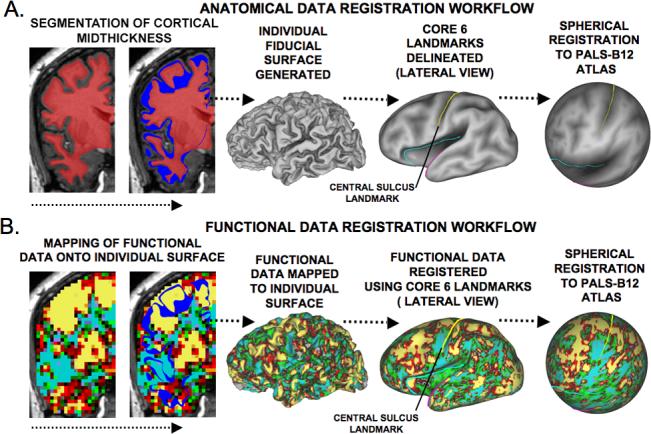
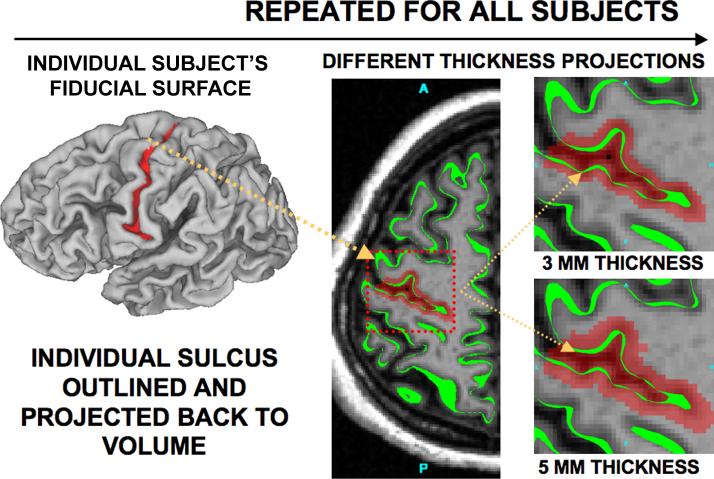
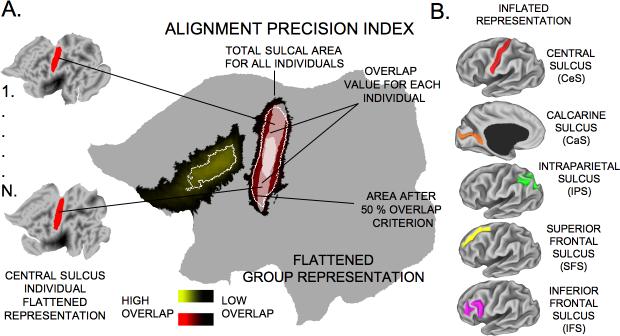
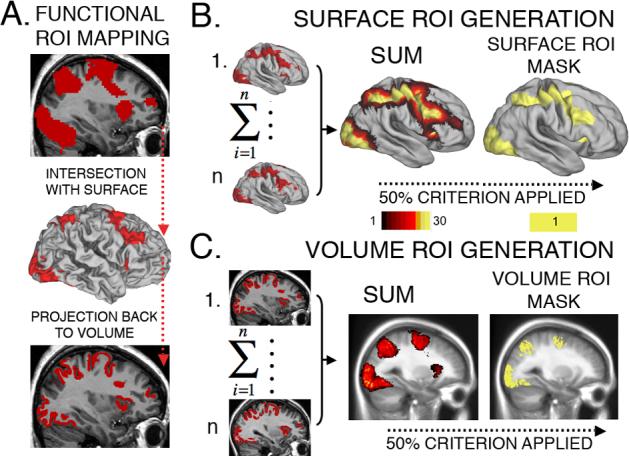
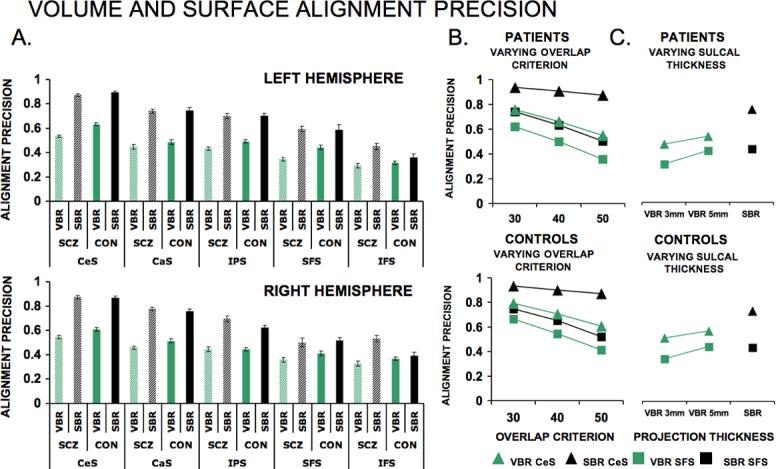
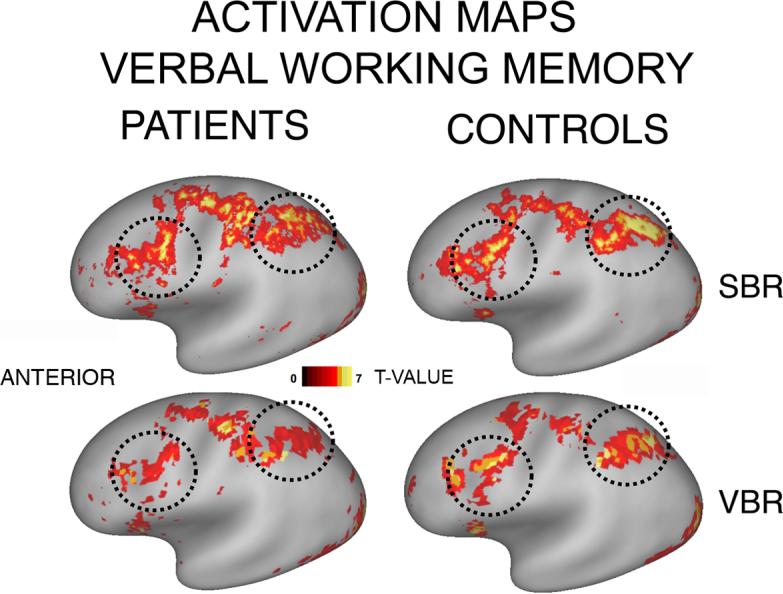
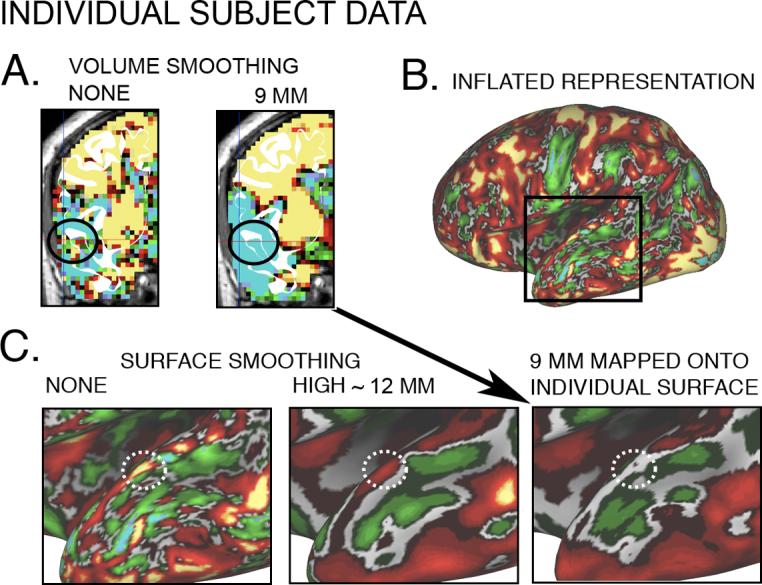
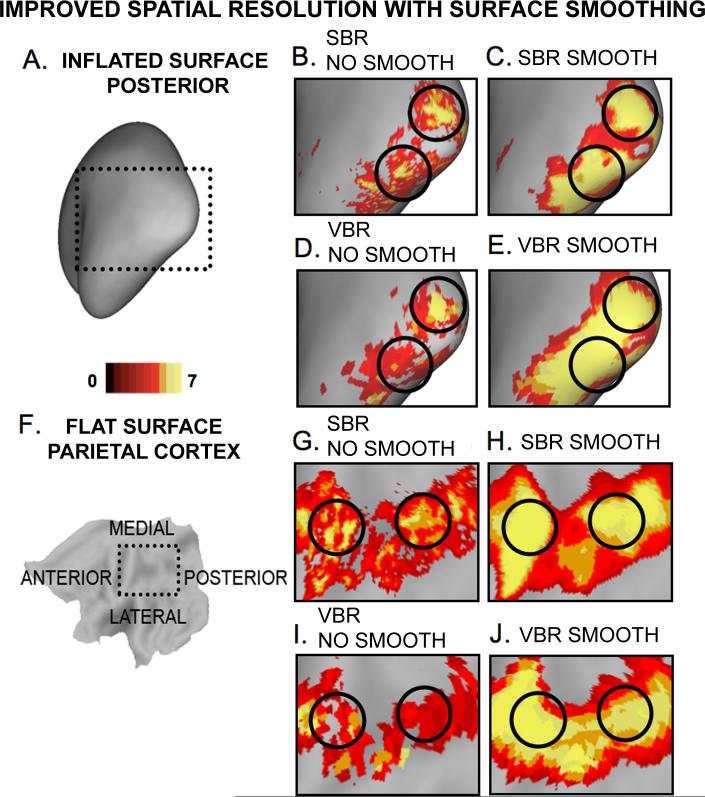
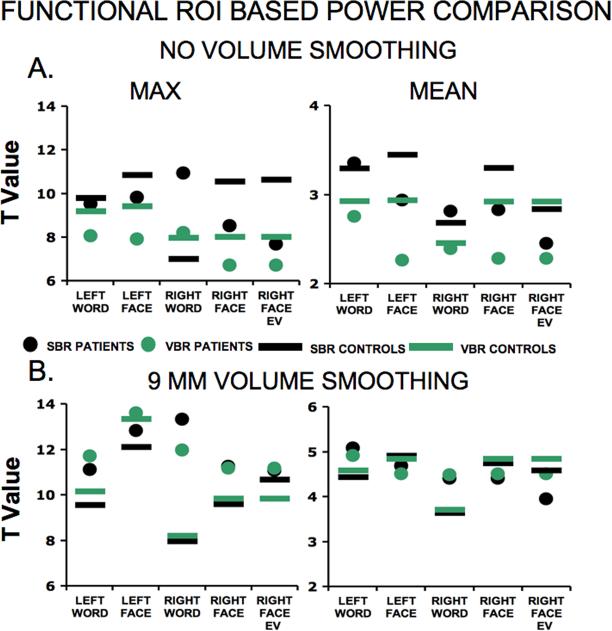
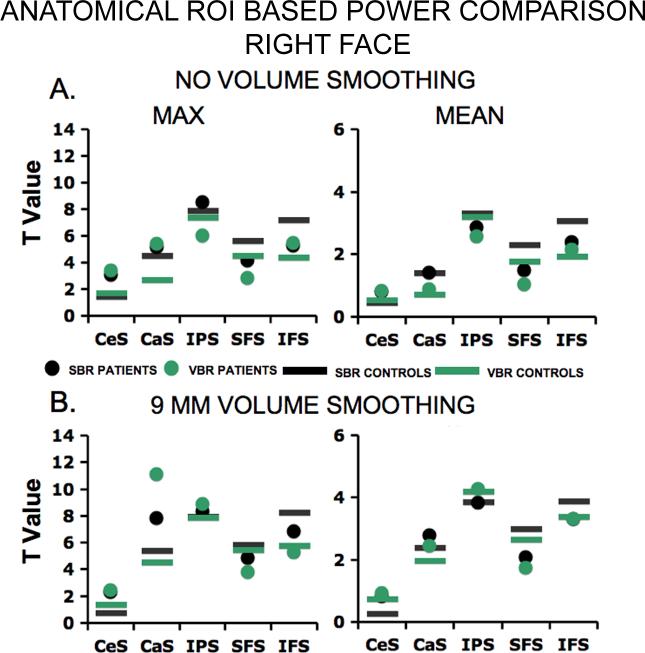
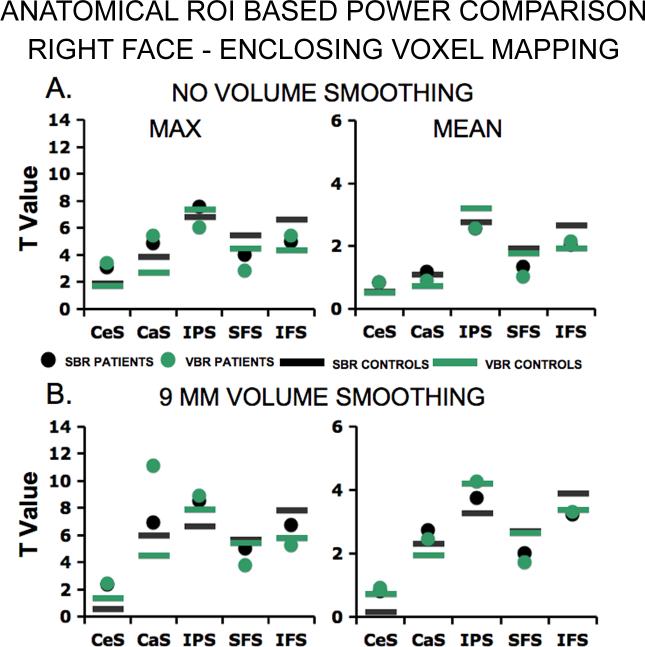
A major challenge in functional neuroimaging is to cope with individual variability in cortical structure and function. Most analyses of cortical function compensate for variability using affine or low-dimensional nonlinear volume-based registration (VBR) of individual subjects to an atlas, which does not explicitly take into account the geometry of cortical convolutions. A promising alternative is to use surface-based registration (SBR), which capitalizes on explicit surface representations of cortical folding patterns in individual subjects. In this study, we directly compare results from SBR and affine VBR in a study of working memory in healthy controls and patients with schizophrenia (SCZ). Each subject's structural scan was used for cortical surface reconstruction using the SureFit method. fMRI data were mapped directly onto individual cortical surface models, and each hemisphere was registered to the population-average PALS-B12 atlas using landmark-constrained SBR. The precision with which cortical sulci were aligned was much greater for SBR than VBR. SBR produced superior alignment precision across the entire cortex, and this benefit was greater in patients with schizophrenia. We demonstrate that spatial smoothing on the surface provides better resolution and signal preservation than a comparable degree of smoothing in the volume domain. Lastly, the statistical power of functional activation in the working memory task was greater for SBR than for VBR. These results indicate that SBR provides significant advantages over affine VBR when analyzing cortical fMRI activations. Furthermore, these improvements can be even greater in disorders that have associated structural abnormalities.


Figures

Figure 1
Figure 1. The general workflow that was used for SBR analysis strategy
(A) Structural data is used for segmentation of cortical midthickness and a surface outline is created (blue ribbon). A fiducial surface representation is generated and Core-6 sulcal landmarks are outlined and are shown on the inflated surface representation. The Core-6 landmarks are used for spherical registration to the PALS-B12 atlas. (B) fMRI data that intersect the fiducial surface outline are first mapped onto corresponding nodes of the subject's surface model and then deformed to the PALS-B12 atlas using the same information obtained from spherical registration of anatomical data.
Figure 2
Figure 2. The procedure for sulcal delineation on the surface and projection back to a volume representation
An individual subject's sulcal outline (central sulcus shown) was outlined in a surface representation (left panel) and projected back into a volume representation (middle panel). The far top right panel shows the results of projecting the central sulcus back into 3D representation at 3mm thickness of the cortical ribbon and the far bottom right panel shows the result for 5mm thickness.
Figure 3
Figure 3. The procedure for alignment precision quantification
The sulcal outlines were used to quantify alignment precision in volume and surface representations. (A) The group probabilistic overlap map is shown in red-to-black gradient for CeS and yellow-to-black gradient for the SFS on the large flattened surface. Darker values mark less overlap across all individuals and brighter values mark more overlap. The white dotted outline inside the map is an illustration of the center of overlap after an overlap criterion was applied (e.g. 50%, for more detail see method section). Each subject's sulcal map (bleached white outlines on the main flattened surface) is intersected with the overlap criterion region. The intersection provides a value of overlap for each individual. This value is expressed as a fraction of that subject's total sulcal area (see Eq. 1). This metric captures the percentage of a person's sulcal territory, which falls inside the criterion area (white outline). This process is repeated for all individuals in a group. (B) The same steps are repeated for three more sulcal locations: calcarine sulcus, intraparietal sulcus and the inferior-frontal sulcus.
Figure 4
Figure 4. The method for generating ROIs (both structural and functional) used for power comparisons in VBR and SBR
(A) Top panel: the functional ROI defined using conjunction analyses in 3D (all voxels that were active in both working memory domains across both patients and controls). Middle panel:group functional ROI mapped onto a subject's surface, thus limiting activation to the cortical ribbon. Bottom panel: cortical activation mapped back into the volume domain, thereby preserving only cortical signals. (B) After repeating this process for each subject's surface (left), the activation ROIs were summed (center), and regions above a threshold overlap (50%) were set to a value of 1 (right) to yield the final surface functional ROI mask. The mask shown is for controls; the mask for patients was very similar. (C) The individual cortical ROIs were mapped to volume representation (left), summed (middle), and regions above a threshold overlap (50%) were set to a value of 1 (right). This resulted in equivalently generated functional ROI masks for both surface and volume domains.
Figure 5
Figure 5. Alignment precision quantification
(A) Alignment precision results for left (top) and right (bottom) hemispheres. In each graph results are plotted in decreasing order of alignment precision for the five sulci. For each sulcus, results for both patient (shaded colors) and control (solid colors) groups are shown for both SBR (black) and VBR (green). (B) Results of decreasing overlap criterion for alignment precision metrics for SBR (black) and VBR (green) shown for patients (top) and controls (bottom) in the CeS (triangles) and SFS (squares). (C) Results of varying cortical thickness when projecting sulcal outlines to 3D domain shown for patients (top) and controls (bottom) for SBR (black) and VBR (green) in CeS (triangles) and SFS (squares).
Figure 6
Figure 6. Statistical maps for SBR and VBR results
Activation pattern for verbal working memory task (thresholded at t>3; above-baseline activations only). Both volume and surface data were mapped to the PALS-B12 very inflated surface. Top and bottom panels: SBR and VBR results, respectively. Left and right panels: results for patients and controls, respectively. Black dotted circles indicate prefrontal and parietal regions where activations are stronger for SBR, especially in patients.
Figure 7
Figure 7. Effect of 2D and 3D smoothing on spatial configuration of fMRI signal in a single subject
(A) Coronal slices of left hemisphere verbal working memory fMRI pattern before smoothing (left panel), with a signal (red, yellow voxels inside black circle) near the superior temporal gyrus (STG, white cortical ribbon outline) and after volume smoothing (right panel), with loss of STG activation patch (no red or yellow voxels inside black circle)(B) Same activation pattern as in (A) mapped to the individual left hemisphere using the IV method and displayed on a very inflated surface. Boxed region centered on the STG is expanded in (C). (C) Surface maps centered on STG (white circle) show activation visible before smoothing (left panel), and after surface smoothing(center panel; ∼12 mm FWHM Gaussian kernel), but not after volume smoothing (right panel; 9 mm Gaussian kernel).
Figure 8
Figure 8. Improved spatial resolution for surface smoothing vs volume smoothing
Verbal working memory activations are shown (t>3) for the left hemisphere. (A) Inflated cortical map with rectangular selection centered on the primary visual cortex. (B) SBR data with no smoothing applied. The two activation peaks are highlighted with black circles. (C) SBR data with high smoothing strength applied (∼12 mm FWHM Gaussian kernel). The peak separation inside the black outlines is still preserved. (D) VBR data with no smoothing applied. The peak separation inside the black outlines is still preserved, although clearly attenuated. (E) VBR data with a 9 mm Gaussian kernel applied. The peak separation inside the black outlines is lost and there is spreading of the signal beyond the level observed when even stronger smoothing was applied on the surface. (F-J) The same pattern of results is shown for a selection centered on the left parietal cortex shown in a flattened representation.
Figure 9
Figure 9. Power comparison results using the functional ROI
(A) Unsmoothed data are shown two parameters (max and mean) for both hemispheres and both working memory conditions. Green and black data points show VBR and SBR results respectively with patient data shown in circles and control data are shown in horizontal bars. Overall, there is an elevated power profile for SBR. (B) Analogous results are shown with 9 mm Gaussian kernel smoothing in 3D, then analyzed in surface and volume. The far right category on the abscissa shows data mapped using the EV method for non-verbal working memory on the right hemisphere.
Figure 10
Figure 10. Power comparison using anatomical ROIs (right hemisphere, face working memory)
(A) Data are shown across all five anatomical ROIs. Green (B) Analogous results are shown for smoothed data.
Figure 11
Figure 11. Power comparison using anatomical ROIs (right hemisphere, face working memory) enclosing voxel mapping
The data in this figure were mapped onto individual surface models using the enclosing voxel technique and follow the same outline as figure 10.

References

    1. Acton PD, Friston KJ. Statistical parametric mapping in functional neuroimaging: beyond PET and fMRI activation studies. Eur. J. Nucl. Med. 1998;25:663–667. - PubMed
    1. Andrade A, Kherif F, Mangin JF, Worsley KJ, Paradis AL, Simon O, et al. Detection of fmri activation using cortical surface mapping. Human brain mapping. 2001;12(2):79. - PMC - PubMed
    1. Argall BD, Saad ZS, Beauchamp MS. Simplified intersubject averaging on the cortical surface using suma. Human brain mapping. 2006;27(1):14. - PMC - PubMed
    1. Ashburner J, K.J. Friston KJ. High-Dimensional Nonlinear Image Registration. NeuroImage. 1998;7(4):S737. 1998. - PubMed
    1. Baddeley AD. Working memory. Oxford University Press; New York: 1986.

Publication types