. 2008 Jul;90(1):200-16.
doi: 10.1016/j.nlm.2008.02.009. Epub 2008 Apr 22.

Asymmetrical stimulus generalization following differential fear conditioning

Affiliations

Asymmetrical stimulus generalization following differential fear conditioning

Sun Jung Bang et al. Neurobiol Learn Mem. 2008 Jul.

Erratum in

  • Neurobiol Learn Mem. 2008 Oct;90(3):588

Abstract

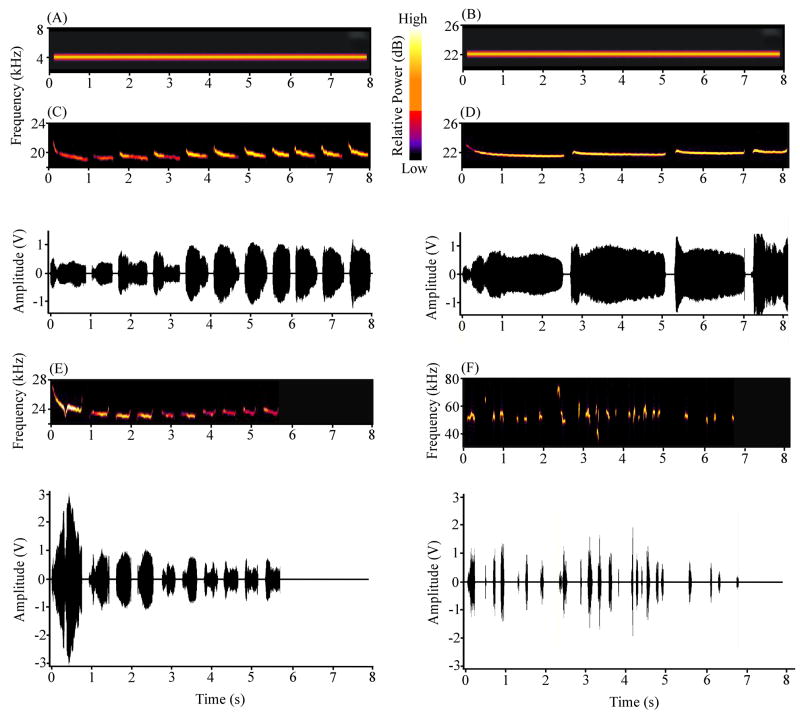
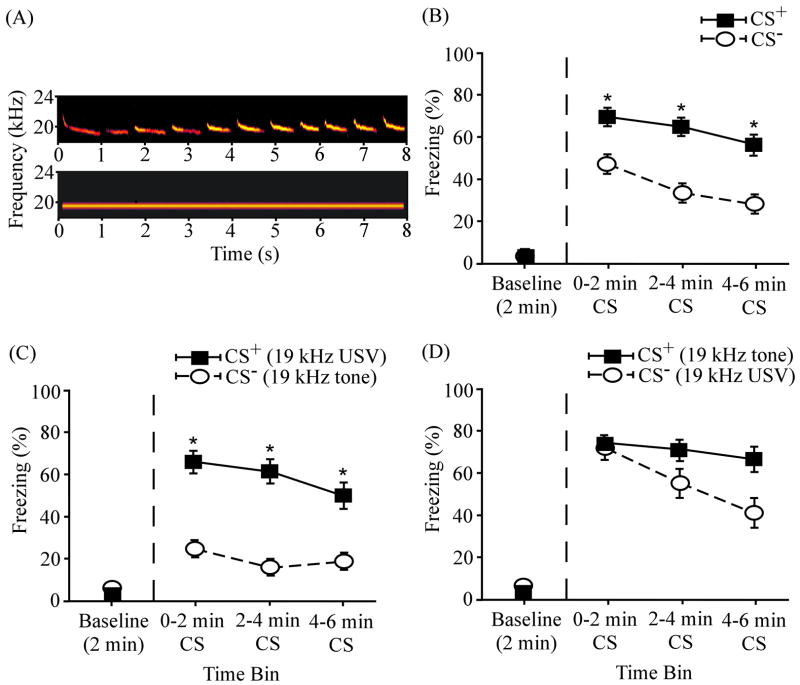
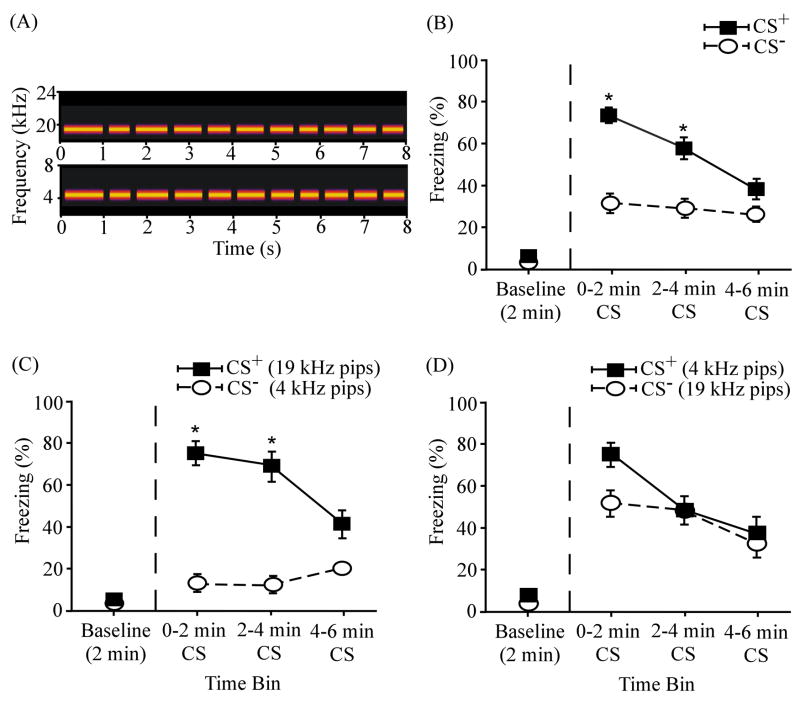
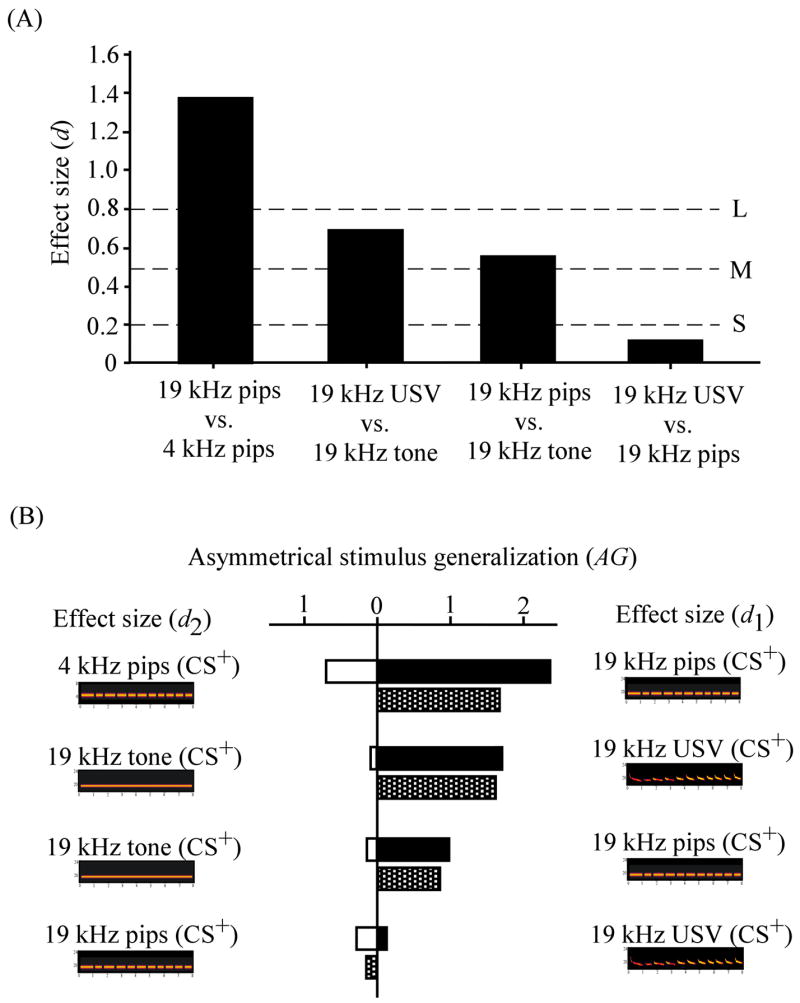
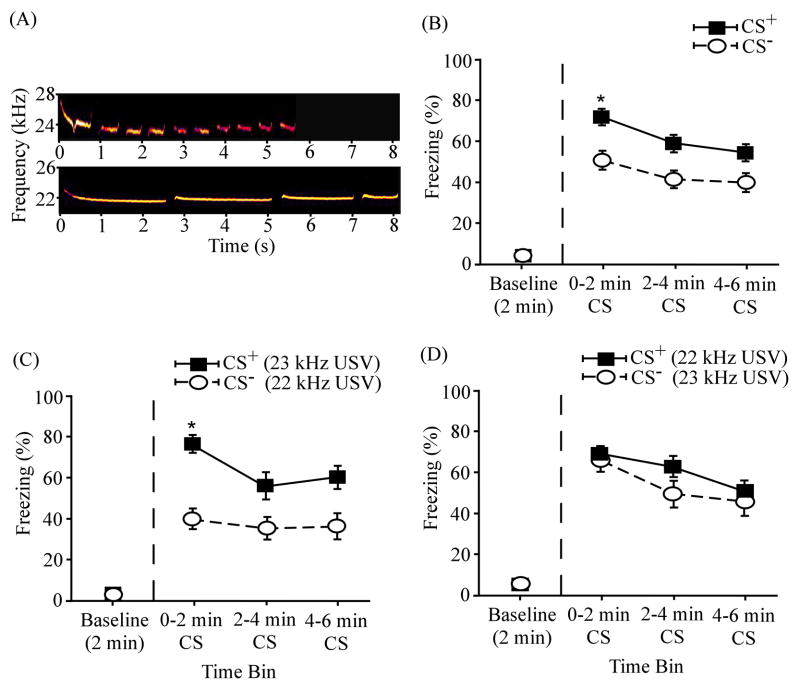
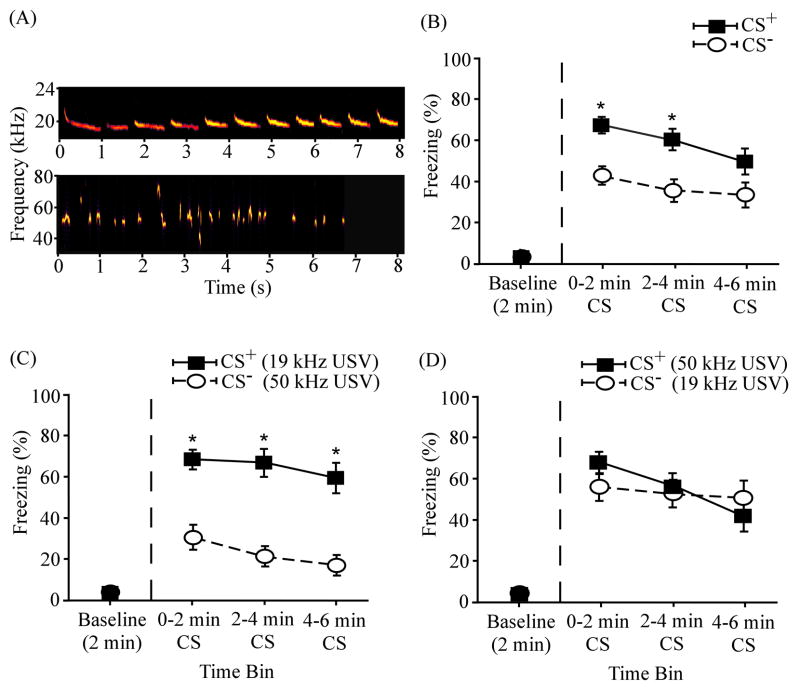
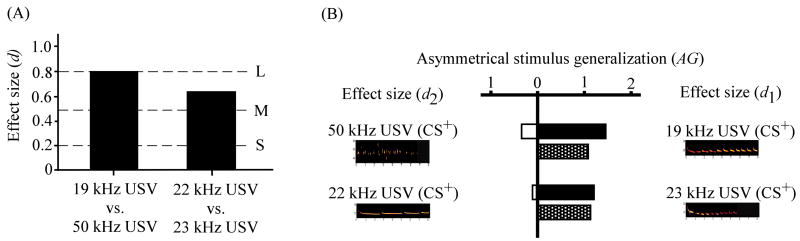
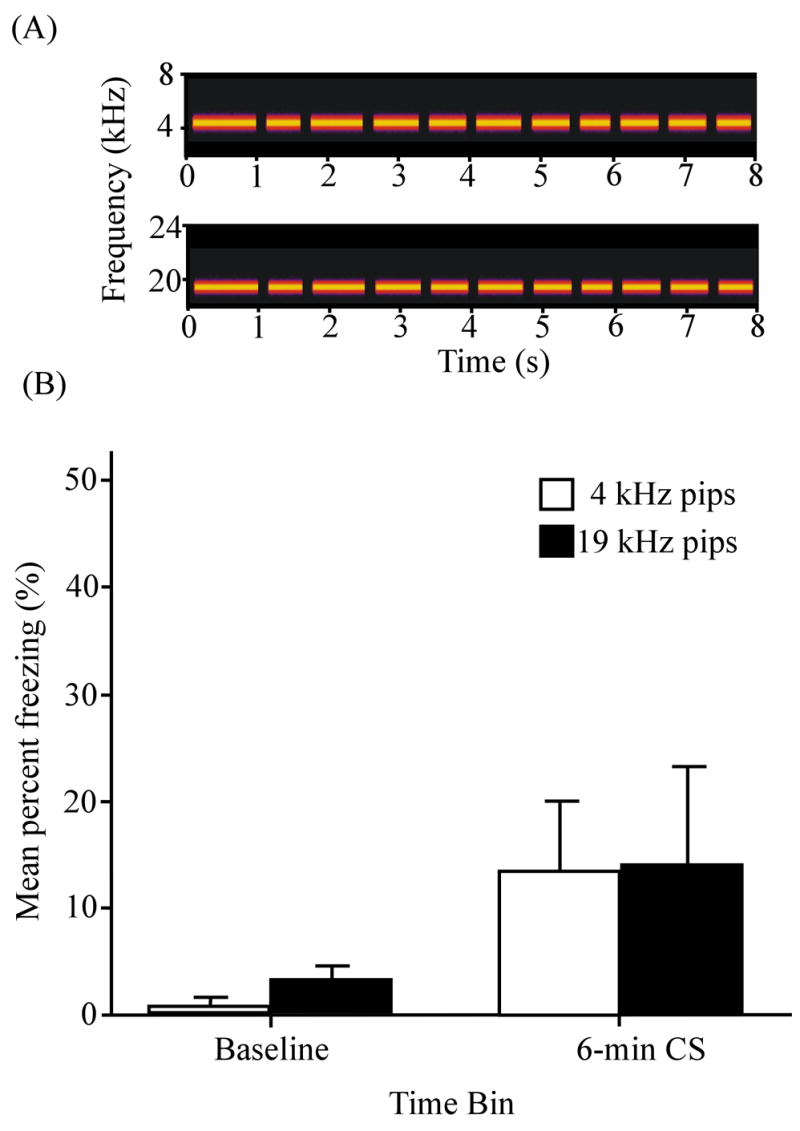
Rodent ultrasonic vocalizations (USVs) are ethologically critical social signals. Rats emit 22kHz USVs and 50kHz USVs, respectively, in conjunction with negative and positive affective states. Little is known about what controls emotional reactivity to these social signals. Using male Sprague-Dawley rats, we examined unconditional and conditional freezing behavior in response to the following auditory stimuli: three 22kHz USVs, a discontinuous tone whose frequency and on-off pattern matched one of the USVs, a continuous tone with the same or lower frequencies, a 4kHz discontinuous tone with an on-off pattern matched to one of the USVs, and a 50kHz USV. There were no differences among these stimuli in terms of the unconditional elicitation of freezing behavior. Thus, the stimuli were equally neutral before conditioning. During differential fear conditioning, one of these stimuli (the CS(+)) always co-terminated with a footshock unconditional stimulus (US) and another stimulus (the CS(-)) was explicitly unpaired with the US. There were no significant differences among these cues in CS(+)-elicited freezing behavior. Thus, the stimuli were equally salient or effective as cues in supporting fear conditioning. When the CS(+) was a 22kHz USV or a similar stimulus, rats discriminated based on the principal frequency and/or the temporal pattern of the stimulus. However, when these same stimuli served as the CS(-), discrimination failed due to generalization from the CS(+). Thus, the stimuli differed markedly in the specificity of conditioning. This strikingly asymmetrical stimulus generalization is a novel bias in discrimination.


Figures

Figure 1
Figure 1
Spectrograms and amplitude plots of the six auditory stimuli used in this study. (A) A continuous 4 kHz tone (7.91 s). (B) A continuous 22 kHz tone (7.91 s). (C) A 19 kHz USV (7.91 s, 11 calls). (D) A 22 kHz USV (8.13 s, 4 calls). (E) A 23 kHz USV (5.71 s, 11 calls). (F) A 50 kHz USV (6.74 s, 26 calls). The four USVs were recorded from different rats.
Figure 2
Figure 2
Experimentally naïve rats fail to freeze in response to USVs and synthetic stimuli. The mean percentage of time spent freezing is plotted before (white box), during (gray box), and after (black box) the auditory stimulus presentations. The stimuli (see Fig. 1) include a 4 kHz tone (n = 8), a 22 kHz tone (n = 8), a 19 kHz USV (n = 8), a 22 kHz USV (n = 8), a 23 kHz USV (n = 8), and a 50 kHz USV (n = 6). Error bars represent ±1 standard error (SE).
Figure 3
Figure 3
Differential fear conditioning to a 19 kHz USV and a 19 kHz continuous tone. (A) Spectrograms of the 19 kHz USV (top) and the 19 kHz continuous tone (bottom). (B) Overall mean percentage of time spent freezing to the CS+ and the CS (N = 24) as a function of time. (C) Mean percent freezing among the subset of subjects (n = 12) that received the 19 kHz USV (part A, top) as the CS+ and 19 kHz continuous tone (part A, bottom) as the CS. (D) Mean percent freezing among subjects (n = 12) that received the 19 kHz continuous tone as the CS+ and 19 kHz USV as the CS. The baseline level of freezing (before the CS onset) is plotted on the left of the vertical dashed line. Asterisks (*) denote significant differences between CS+ and CS. Error bars represent ± 1 SE.
Figure 4
Figure 4
Differential fear conditioning to 19 kHz discontinuous and continuous tones. (A) Spectrograms of the 19 kHz discontinuous tone pips (top) and the 19 kHz continuous tone (bottom). (B) Overall mean percent freezing to the CS+ and the CS (N = 24). (C) Mean percent freezing among subjects (n = 12) that received the 19 kHz pips (part A, top) as the CS+ and 19 kHz continuous tone (part A, bottom) as the CS. (D) Mean percent freezing among subjects (n = 12) that received the 19 kHz continuous tone as the CS+ and 19 kHz pips as the CS. The baseline level of freezing (before the CS onset) is plotted on the left of the vertical dashed line. Asterisks (*) denote significant differences between CS+ and CS. Error bars represent ± 1 SE.
Figure 5
Figure 5
Differential fear conditioning to a 19 kHz pips and a 4 kHz pips. (A) Spectrograms of the 19 kHz discontinuous tone pips (top) and the 4 kHz discontinuous tone pips (bottom). (B) Overall mean percent freezing to the CS+ and the CS (N = 16). (C) Mean percent freezing among subjects (n = 8) that received 19 kHz pips (part A, top) as the CS+ and 4 kHz pips (part A, bottom) as the CS-. (D) Mean percent freezing among subjects (n = 8) that received 4 kHz pips as the CS+ and 19 kHz pips as the CS. The baseline level of freezing (before the CS onset) is plotted on the left of the vertical dashed line. Asterisks (*) denote significant differences between CS+ and CS. Error bars represent ± 1 SE.
Figure 6
Figure 6
Differential fear conditioning to a 19 kHz USV and a 19 kHz discontinuous tone. (A) Spectrograms of the 19 kHz USV (top) and the 19 kHz discontinuous tone pips (bottom). (B) Overall mean percent freezing to the CS+ and the CS (N = 17). (C) Mean percent freezing among subjects (n = 8) that received 19 kHz USV (part A, top) as the CS+ and 19 kHz pips (part A, bottom) as the CS. (D) Mean percent freezing among subjects (n = 9) that received 19 kHz pips as the CS+ and 19 kHz USV as the CS. The baseline level of freezing (before the CS onset) is plotted on the left of the vertical dashed line. Asterisks (*) denote significant differences between CS+ and CS. Error bars represent ± 1 SE.
Figure 7
Figure 7
Effect sizes for discrimination and magnitudes of asymmetrical generalization. (A) Overall effect size (d from Eq. 1) for discrimination between the CS+ and CS for each of four stimulus pairs. The three horizontal dotted lines denote small (S), medium (M), and large (L) effect sizes (see Cohen, 1988). (B) The black and white bars are partial effect sizes for discrimination (d1 and d2 from Eqs. 2 & 3). For each cue pair, the more USV-like stimulus (d1) is plotted on the right (black bars). The stippled bar is the amount of asymmetrical generalization (AG from Eq. 4).
Figure 8
Figure 8
Differential fear conditioning to a 23 kHz USV and a 22 kHz USV. (A) Spectrograms of the 23 USV (top) and the 22 kHz USV (bottom). (B) Overall mean percent freezing to the CS+ and the CS (N = 20). (C) Mean percent freezing among subjects (n = 10) that received the 23 kHz USV (part A, top) as the CS+ and the 22 kHz USV (part A, bottom) as the CS. (D) Mean percent freezing among subjects (n = 10) that received the 22 kHz USV as the CS+ and the 23 kHz USV as the CS. The baseline level of freezing (before the CS onset) is plotted on the left of the vertical dashed line. Asterisks (*) denote significant differences between CS+ and CS. Error bars represent ± 1 SE.
Figure 9
Figure 9
Differential fear conditioning to a 19 kHz USV and a 50 kHz USV. (A) Spectrograms of the 19 kHz USV (top) and the 50 kHz USV (bottom). (B) Overall mean percent freezing to the CS+ and the CS (N = 20). (C) Mean percent freezing among subjects (n = 10) that received the 19 kHz USV (part A, top) as the CS+ and the 50 kHz USV (part A, bottom) as the CS. (D) Mean percent freezing among subjects (n = 10) that received the 50 kHz USV as CS+ and the 19 kHz USV as CS. The baseline level of freezing (before the CS onset) is plotted on the left of the vertical dashed line. Asterisks (*) denote significant differences between CS+ and CS. Error bars represent ± 1 SE.
Figure 10
Figure 10
Effect sizes for discrimination and magnitudes of asymmetrical generalization. (A) Overall effect size (d from Eq. 1) for discrimination between the CS+ and CS for each of the 2 stimulus pairs. The 3 horizontal dotted lines denote small (S), medium (M), and large (L) effect sizes (see Cohen, 1988). (B) The black and white bars are partial effect sizes for discrimination (d1 and d2 from Eqs. 2 & 3). For each cue pair, the more USV-like stimulus (d1) is plotted on the right (black bars). The stippled bar is the amount of asymmetrical generalization (AG from Eq. 4).
Figure 11
Figure 11
Pseudo-conditioning using 4 kHz and 19 kHz discontinuous tones. This stimulus pair was selected because it previously resulted in the greatest overall discrimination (Fig. 7A) and asymmetrical generalization (Fig. 7B). (A) Spectrograms of the 4 kHz tone pips (top; same as Fig. 5A bottom) and the 19 kHz tone pips (bottom; same as Fig. 5A top). (B) Mean percent freezing during the 2 min baseline period and during 6 min of cue presentation (N = 8). White and black bars denote 4 kHz pips and 19 kHz pips, respectively. Error bars represent ± 1 SE.

References

    1. Allen TA, Furtak SC, Brown TH. Single-unit responses to 22 kHz ultrasonic vocalizations in rat perirhinal cortex. Behavioural Brain Research. 2007;182(2):327–336. - PMC - PubMed
    1. Anderson JW. The production of ultrasonic sounds by laboratory rats and other mammals. Science. 1954;119(3101):808–809. - PubMed
    1. Barfield RJ, Geyer LA. Sexual behavior: Ultrasonic postejaculatory song of the male rat. Science. 1972;176(41):1349–1350. - PubMed
    1. Bhagavan S, Smith BH. Olfactory conditioning in the honey bee, Apis mellifera: Effects of odor intensity. Physiology & Behavior. 1997;61(1):107–117. - PubMed
    1. Blair HT, Sotres-Bayon F, Moita MA, LeDoux JE. The lateral amygdala processes the value of conditioned and unconditioned aversive stimuli. Neuroscience. 2005;133(2):561–569. - PubMed

Publication types