. 2008 Aug;22(8):2920-7.
doi: 10.1096/fj.08-105775. Epub 2008 Apr 23.

Abundance and stability of complexes containing inactive G protein-coupled receptors and G proteins

Affiliations

Abundance and stability of complexes containing inactive G protein-coupled receptors and G proteins

Kou Qin et al. FASEB J. 2008 Aug.

Abstract

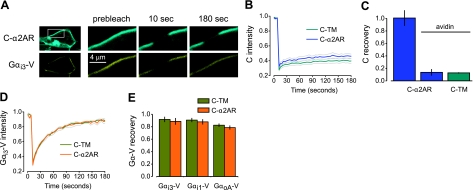
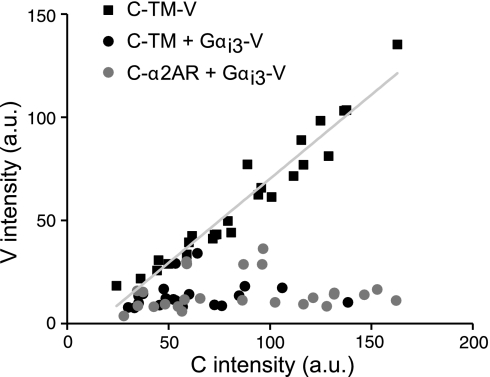
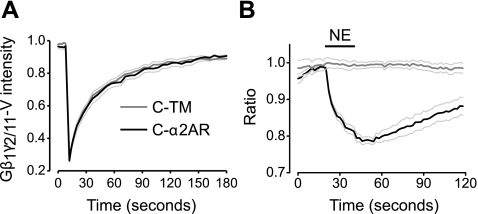
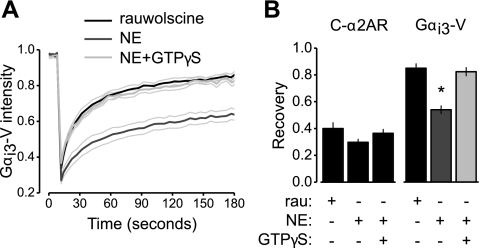
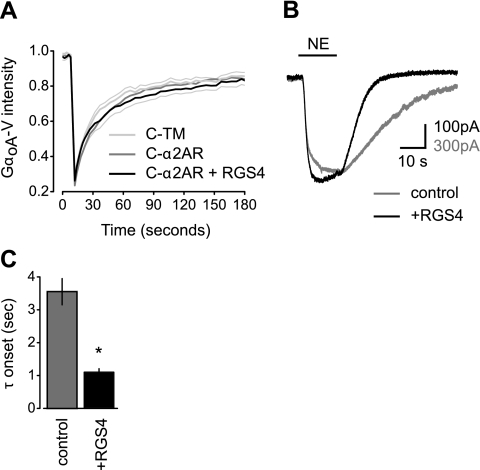
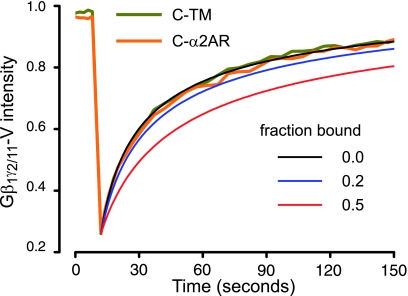
G protein-coupled receptors (GPCRs) interact directly with heterotrimeric G proteins to transduce physiological signals. Early studies of this interaction concluded that GPCRs (R) and G proteins (G) collide with each other randomly after receptor activation and that R-G complexes are transient. More recent studies have suggested that inactive R and G are preassembled (precoupled) as stable R-G complexes. Here we examine the stability of complexes formed between cyan fluorescent protein-labeled alpha(2A)-adrenoreceptors (C-alpha2ARs) and G proteins in cells using fluorescence recovery after photobleaching (FRAP). Labeled G proteins diffused in the plasma membrane with equal mobility in the absence and presence of immobile C-alpha2ARs. Immobile C-alpha2ARs activated labeled G proteins, demonstrating functional coupling without stable physical association. In contrast, a stable R-G interaction was detected when G proteins were deprived of nucleotides and C-alpha2ARs were active, as predicted by the ternary complex model. Overexpression of regulator of G protein signaling 4 (RGS4) accelerated the onset of effector activation but did not detectably alter the interaction between C-alpha2ARs and G proteins. We conclude that at most a small fraction of C-alpha2ARs and G proteins exist as R-G complexes at any moment.


Figures

Figure 1.
Figure 1.
Immobile C-α2ARs do not restrict the mobility of Gα-V subunits. A) Exemplary images of an avidin-cross-linked cell expressing C-α2ARs and Gαi3-V during a FRAP experiment; inset in top left panel indicates position of remaining panels. Images are shown before (prebleach), immediately after (10 s), and 3 min after (180 s) photobleaching of a 4 μm segment of plasma membrane. C-α2AR fluorescence fails to recover into the bleached region, whereas Gαi3-V fluorescence recovers completely. B) Mean CFP intensity vs. time is plotted for avidin-cross-linked cells expressing C-α2ARs or the control protein C-TM, unlabeled Gβ1 and Gγ2 subunits, and Gαi3-V; in all FRAP plots, gray lines indicate mean ± se, and photobleaching occurred at 10 s. C) CFP fluorescence recovery at 180 s is plotted for biotinylated control cells expressing C-α2ARs (n=7), avidin-cross-linked cells expressing C-α2ARs (n=8), and avidin-cross-linked cells expressing C-TM (n=19); error bars represent se. D) Mean venus intensity vs. time is plotted for avidin-cross-linked cells expressing C-α2ARs or the control protein C-TM and Gαi3-V. E) Venus fluorescence recovery at 180 s is plotted for avidin-cross-linked cells expressing C-α2ARs or C-TM and Gαi3-V (n=11 and 11, respectively), Gαi1-V (n=9 and 8), or GαoA-V (n=12 and 10).
Figure 2.
Figure 2.
C-α2ARs are present in excess of Gαi3-V subunits. Venus intensity [arbitrary units (a.u.)] in a plasma membrane region of interest is plotted against CFP intensity in the same region for individual cells expressing C-TM-V (n=25), C-TM and Gαi3-V (n=20), or C-α2ARs and Gαi3-V (n=25). A linear least-squares fit (slope=0.81; r=0.97) to the C-TM-V values is shown superimposed.
Figure 3.
Figure 3.
Immobile C-α2ARs activate but do not restrict the mobility of heterotrimers containing Gβ1γ2/11-V dimers. A) Mean venus intensity vs. time is plotted for avidin-cross-linked cells expressing C-α2ARs (n=11) or the control protein C-TM (n=11) together with unlabeled GαoA subunits and Gβ1γ2/11-V dimers. B) Normalized ratio of plasma membrane to intracellular Gβ1γ2/11-V fluorescence is plotted against time for cells expressing either C-TM (n=12) or C-α2ARs (n=9) together with unlabeled GαoA and Gβ1γ2/11-V dimers; translocation of Gβ1γ2/11-V from the plasma membrane to the cell interior indicates heterotrimer activation and dissociation. NE (100 μM) was applied where indicated by horizontal bar.
Figure 4.
Figure 4.
Agonist-activated immobile C-α2ARs restrict the mobility of Gαi3-V subunits in permeabilized, nucleotide-deprived cells. A) Mean venus intensity vs. time is plotted for antibody-cross-linked cells expressing C-α2ARs, unlabeled Gβ1 and Gγ2 subunits, and Gαi3-V. Cells were permeabilized with α-hemolysin and exposed to the antagonist rauwolscine (10 μM; n=12), NE (100 μM; n=22), or NE and 0.3 mM GTPγS (n=20), a poorly hydrolyzable analog of GTP. B) CFP and venus fluorescence recovery at 180 s is plotted for the same cells as A; *P < 0.001.
Figure 5.
Figure 5.
RGS4 overexpression accelerates GIRK channel activation but does not induce stable complexes between C-α2ARs and GαoA-V-containing heterotrimers. A) Mean venus intensity vs. time is plotted for avidin-cross-linked cells expressing unlabeled Gβ1 and Gγ2 subunits, GαoA-V, and either the control protein C-TM (n=9), C-α2ARs alone (n=9), or C-α2ARs together with RGS4 (n=9). B) Exemplary traces from cells expressing C-α2ARs, unlabeled Gβ1 and Gγ2 subunits, GαoA-V, and GIRK channel subunits with or without RGS4; NE (100 μM) was applied where indicated by the horizontal bar. C) Grouped data from experiments identical to those shown in B showing the mean monoexponential GIRK activation time constant (τ) for control cells (n=16) and cells expressing RGS4 (n=16; *P<0.001).
Figure 6.
Figure 6.
Limits of detection of FRAP for binding. Fluorescence recovery curves (taken from Fig. 3) are replotted, and the control trace (C-TM) is fitted to an empirical equation yielding a diffusion coefficient (D=0.11 μm2/s; see Materials and Methods). The fitted curve is taken to represent the mobility of heterotrimers without binding (bound fraction=0). Additional curves are simulated for transient binding of G proteins to C-α2ARs with bound fractions of 0.2 and 0.5 (see Discussion).

References

    1. Tolkovsky A M, Levitzki A. Mode of coupling between the beta-adrenergic receptor and adenylate cyclase in turkey erythrocytes. Biochemistry. 1978;17:3795. - PubMed
    1. Kwok-Keung Fung B, Stryer L. Photolyzed rhodopsin catalyzes the exchange of GTP for bound GDP in retinal rod outer segments. Proc Natl Acad Sci U S A. 1980;77:2500–2504. - PMC - PubMed
    1. Pugh E N, Jr, Lamb T D. Amplification and kinetics of the activation steps in phototransduction. Biochim Biophys Acta. 1993;1141:111–149. - PubMed
    1. Gales C, Van Durm J J, Schaak S, Pontier S, Percherancier Y, Audet M, Paris H, Bouvier M. Probing the activation-promoted structural rearrangements in preassembled receptor-G protein complexes. Nat Struct Mol Biol. 2006;13:778–786. - PubMed
    1. Neubig R R, Gantzos R D, Thomsen W J. Mechanism of agonist and antagonist binding to alpha 2 adrenergic receptors: evidence for a precoupled receptor-guanine nucleotide protein complex. Biochemistry. 1988;27:2374–2384. - PubMed

Publication types

MeSH terms

LinkOut - more resources