Comparative Study
. 2008 Apr 23;28(17):4377-84.
doi: 10.1523/JNEUROSCI.5298-07.2008.

Multiple modes of network homeostasis in visual cortical layer 2/3

Affiliations
Comparative Study

Multiple modes of network homeostasis in visual cortical layer 2/3

Arianna Maffei et al. J Neurosci. .

Abstract

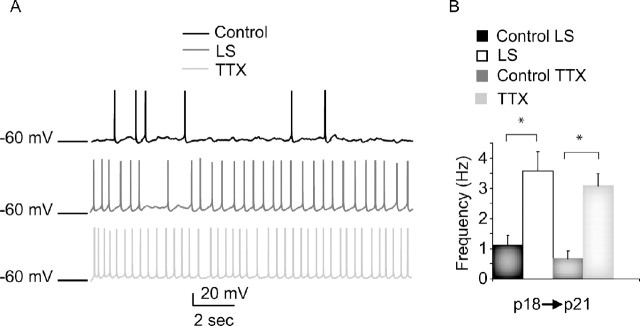
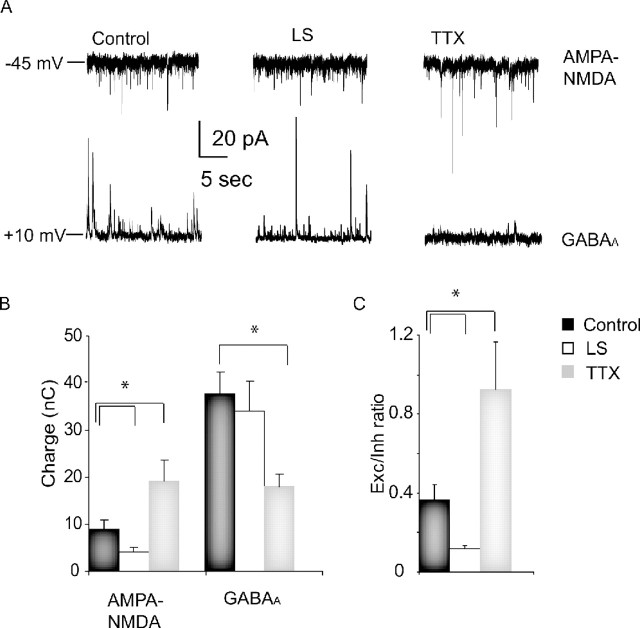
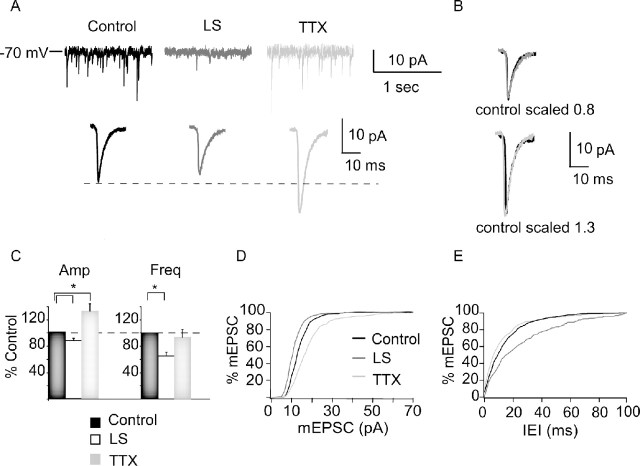
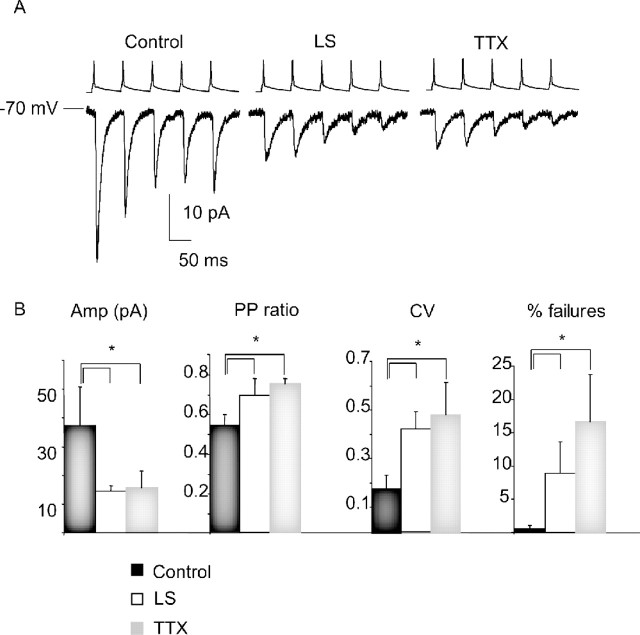
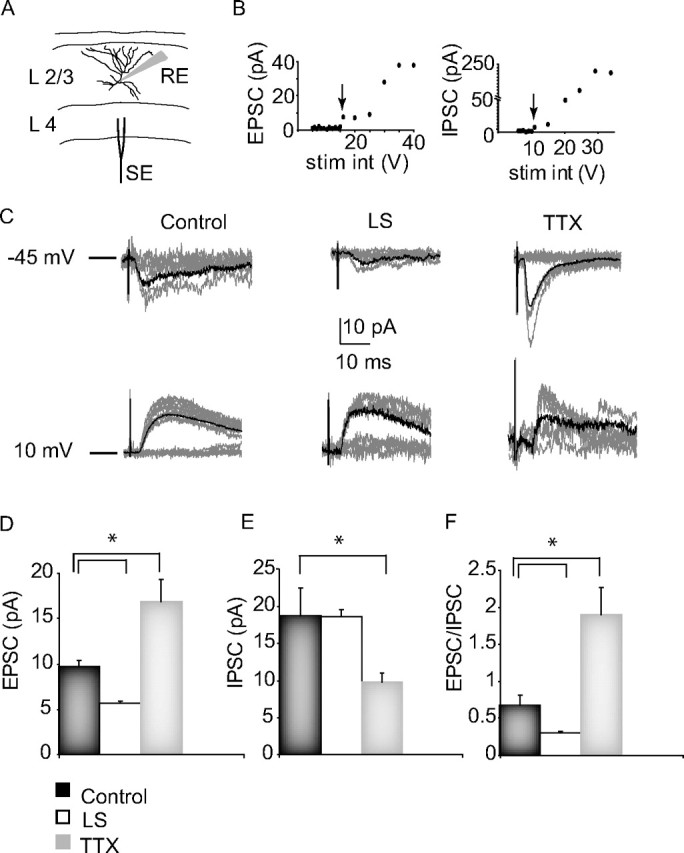
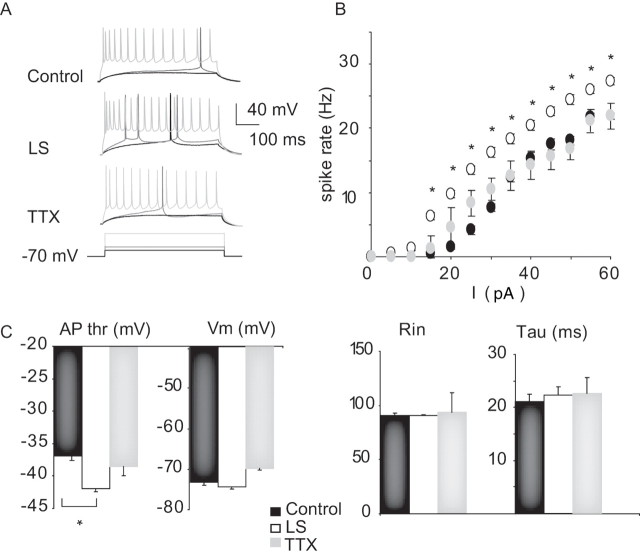
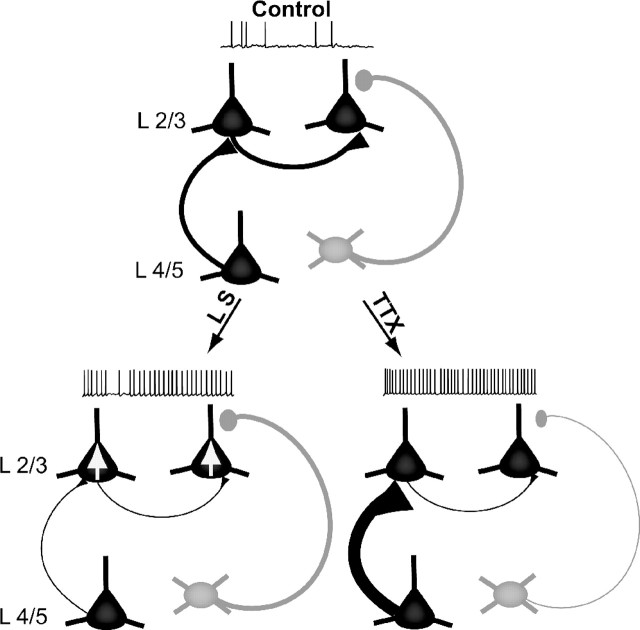
Sensory experience is crucial for shaping the cortical microcircuit during development and is thought to modify network function through several forms of Hebbian and homeostatic plasticity. Where and when these different forms of plasticity are expressed at particular synapse types within cortical microcircuits, and how they interact, is poorly understood. Here we investigated how two different visual deprivation paradigms, lid suture (LS) and intraocular TTX, affect the local microcircuit within layer 2/3 of rat visual cortex during the classical critical period for visual system plasticity. Both forms of visual deprivation produced a compensatory increase in the spontaneous firing of layer 2/3 pyramidal neurons in acute slices derived from monocular visual cortex. TTX increased spontaneous activity through an increase in the excitation/inhibition (E/I) balance within layer 2/3. In contrast, LS decreased the E/I balance by strongly depressing excitatory transmission, and the homeostatic increase in spontaneous activity was instead achieved through an increase in the intrinsic excitability of layer 2/3 pyramidal neurons. The microcircuit in layer 2/3 can thus use different forms of homeostatic plasticity to compensate for the loss of visual drive, depending on the specific demands produced by visual experience. The existence of multiple, partially redundant forms of homeostatic plasticity may ensure that network compensation can be achieved in response to a wide range of sensory perturbations.


Figures

Figure 1.
Figure 1.
Sensory deprivation increased layer 2/3 pyramidal neuron spontaneous firing. A, Examples of spontaneous firing from layer 2/3 pyramidal neurons from control (black), LS (dark gray), and TTX (light gray) conditions. B, Bar plot showing average spontaneous firing frequency for each condition. Data from slices ipsilateral to the sutured eye (control LS; black bar), contralateral to the sutured eye (LS; white bar), ipsilateral to the TTX-injected eye (control TTX; dark gray bar), and contralateral to the TTX-injected eye (TTX; light gray bar) are shown. *Significantly different from control.
Figure 2.
Figure 2.
TTX increases, whereas LS decreases, the E/I balance. A, Examples of spontaneous excitatory and inhibitory synaptic currents from layer 2/3 pyramidal neurons in control, LS, and TTX conditions; neurons were held sequentially at the E rev for GABAA currents (−45 mV) to isolate spontaneous excitatory currents and AMPA–NMDA (+10 mV) to isolate spontaneous inhibitory currents. B, Average excitatory and inhibitory synaptic charge in control (black), LS (white), and TTX (gray) conditions. C, Average excitation (Exc)/inhibition (Inh) ratio (computed for individual neurons and then averaged for each condition) for control (black), LS (white), and TTX (gray) conditions. *Significantly different from control.
Figure 3.
Figure 3.
TTX increases, whereas LS decreases, mEPSC amplitude. A, Example traces showing raw mEPSC recordings (top) and average mEPSCs (bottom) for control (black), LS (dark gray), and TTX (light gray) conditions. B, Scaled average mEPSCs for each condition; control scaled to peak of LS (top) and to peak of TTX (bottom). Note similar kinetics in each condition. C, Average mEPSC amplitude (Amp) and frequency (Freq), computed for each neuron and then averaged for each condition. Data are presented as percentage of control. Black bar, Control; white bar, LS; gray bar, TTX. D, Cumulative distribution of mEPSC amplitudes in control (black), LS (dark gray), and TTX (light gray). E, Cumulative distributions of intereven intervals (IEI) between mEPSC for control (black), LS (dark gray), and TTX (light gray) conditions. For cumulative histograms, 50 events/neuron were included. *Significantly different from control.
Figure 4.
Figure 4.
Both TTX and LS depressed the amplitude of recurrent monosynaptic connections between layer 2/3 pyramidal neurons. A, Examples of evoked recurrent EPSCs in response to the firing of presynaptic neurons at 20 Hz in control, LS, and TTX conditions. B, Average EPSC amplitude (Amp; in picoamperes), paired-pulse ratio (PP ratio), CV, and failure rates (% failures) for control (black bar), LS (white bar), and TTX (gray bar) conditions. *Significantly different from control.
Figure 5.
Figure 5.
The effects of visual deprivation on evoked minimal synaptic transmission onto layer 2/3 pyramidal neurons from lower layers. A, Diagram of the experimental setup, showing the laminar and lateral positions of the whole-cell recording (RE) and the bipolar stimulating electrode (SE), and a morphological reconstruction of a layer 2/3 pyramidal neuron. B, Example EPSC and IPSC amplitude versus stimulus intensity (stim int) plots. The arrows indicate the minimal EPSC and IPSC for this neuron. C, Example minimal evoked EPSCs (−45 mV) and IPSCs (+10 mV) from control, LS, and TTX conditions. Each plot shows 10 responses for each condition (gray traces). The average of 30 events for each condition is overlaid in black. D, Average amplitudes (EPSC), paired-pulse ratio (PP ratio), and CV of minimal EPSC for control (black bar), LS (white bar), and TTX (gray bar) conditions. The same color code will be used also for the plots in E and F. E, Average amplitude (IPSC), PP ratio, and CV of minimal IPSC for each condition. F, Average EPSC/IPSC ratio (computed for each neuron and then averaged for each condition). *Significantly different from control.
Figure 6.
Figure 6.
Plasticity of intrinsic excitability. A, Example firing in response to DC depolarizing current steps for control, LS, and TTX conditions. For each neuron, the response to the same three current injection amplitudes are shown from low (black) to middle (dark gray) to high (light gray). B, Frequency versus current curves for control (black circles), LS (white circles), and TTX (gray circles) conditions. Asterisks highlight significant differences. C, Summary plots for action potential threshold (AP thr), resting membrane potential (V m), resting input resistance (R in), and membrane time constant (tau) for control (black bar), LS (white bar), and TTX (gray bar). Data are mean ± SEM. *Different from control.
Figure 7.
Figure 7.
Summary diagram of microcircuit changes induced by LS and intraocular TTX. Pyramidal neurons (black) and inhibitory interneurons (gray) are show in layers 4 and 2/3, under control conditions (top) and after LS (bottom left) or intraocular TTX injection (bottom right). Both LS and TTX increased the spontaneous firing rate of layer 2/3 pyramidal neurons, but via distinct mechanisms. LS reduced excitatory synaptic drive onto layer 2/3 pyramidal neurons from multiple sources through a mixture of presynaptic and postsynaptic mechanisms (denoted by thin axons) but increased the intrinsic excitability of layer 2/3 pyramidal neurons to compensate (denoted by somatic arrows). In contrast, TTX produced a selective presynaptic depression of recurrent layer 2/3 excitatory connections but scaled up mEPSCs as well as evoked excitatory drive from layer 2/3 (denoted by thick axons), while simultaneously reducing inhibitory drive (denoted by thin axons). The net effect of these changes was to shift the E/I balance toward increased excitation.

References

    1. Aizenman C, Akerman C, Jensen K, Cline H. Visually driven regulation of intrinsic neuronal excitability improves stimulus detection in vivo. Neuron. 2003;39:831–842. - PubMed
    1. Allen CB, Celikel T, Feldman DE. Long-term depression induced by sensory deprivation during cortical map plasticity in vivo. Nat Neurosci. 2003;6:291–299. - PubMed
    1. Bender KJ, Allen CB, Bender VA, Feldman DE. Synaptic basis for whisker deprivation-induced synaptic depression in rat somatosensory cortex. J Neurosci. 2006;26:4155–4165. - PMC - PubMed
    1. Burkhalter A. Intrinsic connections of rat primary visual cortex: laminar organization of axonal projections. J Comp Neurol. 1999;279:171–186. - PubMed
    1. Crozier RA, Wang Y, Liu CH, Bear MF. Deprivation-induced synaptic depression by distinct mechanisms in different layers of mouse visual cortex. Proc Natl Acad Sci USA. 2007;104:1383–1388. - PMC - PubMed

Publication types

LinkOut - more resources