Perceptual decisions between multiple directions of visual motion
- PMID: 18434522
- PMCID: PMC6670944
- DOI: 10.1523/JNEUROSCI.5564-07.2008
Perceptual decisions between multiple directions of visual motion
Abstract
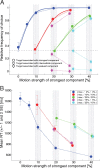
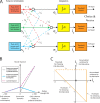
Previous studies and models of perceptual decision making have largely focused on binary choices. However, we often have to choose from multiple alternatives. To study the neural mechanisms underlying multialternative decision making, we have asked human subjects to make perceptual decisions between multiple possible directions of visual motion. Using a multicomponent version of the random-dot stimulus, we were able to control experimentally how much sensory evidence we wanted to provide for each of the possible alternatives. We demonstrate that this task provides a rich quantitative dataset for multialternative decision making, spanning a wide range of accuracy levels and mean response times. We further present a computational model that can explain the structure of our behavioral dataset. It is based on the idea of a race between multiple integrators to a decision threshold. Each of these integrators accumulates net sensory evidence for a particular choice, provided by linear combinations of the activities of decision-relevant pools of sensory neurons.
Figures


Similar articles
-
Perceptual and categorical decision making: goal-relevant representation of two domains at different levels of abstraction.J Neurophysiol. 2017 Jun 1;117(6):2088-2103. doi: 10.1152/jn.00512.2016. Epub 2017 Mar 1. J Neurophysiol. 2017. PMID: 28250149 Free PMC article.
-
Adaptive History Biases Result from Confidence-Weighted Accumulation of past Choices.J Neurosci. 2018 Mar 7;38(10):2418-2429. doi: 10.1523/JNEUROSCI.2189-17.2017. Epub 2018 Jan 25. J Neurosci. 2018. PMID: 29371318 Free PMC article.
-
The cost of accumulating evidence in perceptual decision making.J Neurosci. 2012 Mar 14;32(11):3612-28. doi: 10.1523/JNEUROSCI.4010-11.2012. J Neurosci. 2012. PMID: 22423085 Free PMC article.
-
Bridging Neural and Computational Viewpoints on Perceptual Decision-Making.Trends Neurosci. 2018 Nov;41(11):838-852. doi: 10.1016/j.tins.2018.06.005. Epub 2018 Jul 12. Trends Neurosci. 2018. PMID: 30007746 Free PMC article. Review.
-
Neural correlates of decision processes: neural and mental chronometry.Curr Opin Neurobiol. 2003 Apr;13(2):182-6. doi: 10.1016/s0959-4388(03)00039-4. Curr Opin Neurobiol. 2003. PMID: 12744971 Review.
Cited by
-
Implications of Visual Attention Phenomena for Models of Preferential Choice.Decision (Wash D C ). 2016 Oct;3(4):231-253. doi: 10.1037/dec0000049. Epub 2016 Feb 1. Decision (Wash D C ). 2016. PMID: 27774490 Free PMC article.
-
Inhibition in superior colliculus neurons in a brightness discrimination task?Neural Comput. 2011 Jul;23(7):1790-820. doi: 10.1162/NECO_a_00135. Epub 2011 Apr 14. Neural Comput. 2011. PMID: 21492006 Free PMC article.
-
Multialternative drift-diffusion model predicts the relationship between visual fixations and choice in value-based decisions.Proc Natl Acad Sci U S A. 2011 Aug 16;108(33):13852-7. doi: 10.1073/pnas.1101328108. Epub 2011 Aug 1. Proc Natl Acad Sci U S A. 2011. PMID: 21808009 Free PMC article.
-
An entropic barriers diffusion theory of decision-making in multiple alternative tasks.PLoS Comput Biol. 2018 Mar 2;14(3):e1005961. doi: 10.1371/journal.pcbi.1005961. eCollection 2018 Mar. PLoS Comput Biol. 2018. PMID: 29499036 Free PMC article.
-
An Algorithmic Model of Decision Making in the Human Brain.Basic Clin Neurosci. 2019 Sep-Oct;10(5):443-449. doi: 10.32598/bcn.9.10.395. Epub 2019 Sep 1. Basic Clin Neurosci. 2019. PMID: 32284833 Free PMC article.
References
-
- Albright TD. Direction and orientation selectivity of neurons in visual area MT of the macaque. J Neurophysiol. 1984;52:1106–1130. - PubMed
-
- Bogacz R, Gurney K. The basal ganglia and cortex implement optimal decision making between alternative actions. Neural Comput. 2007;19:442–477. - PubMed
-
- Bogacz R, Brown E, Moehlis J, Holmes P, Cohen JD. The physics of optimal decision making: a formal analysis of models of performance in two-alternative forced-choice tasks. Psychol Rev. 2006;113:700–765. - PubMed
-
- Brainard DH. The psychophysics toolbox. Spat Vis. 1997;10:433–436. - PubMed
Publication types
MeSH terms
LinkOut - more resources
Full Text Sources
