

Early epithelial phenotypic changes predict graft fibrosis
- PMID: 18434568
- PMCID: PMC2488257
- DOI: 10.1681/ASN.2007101160
Early epithelial phenotypic changes predict graft fibrosis
Abstract
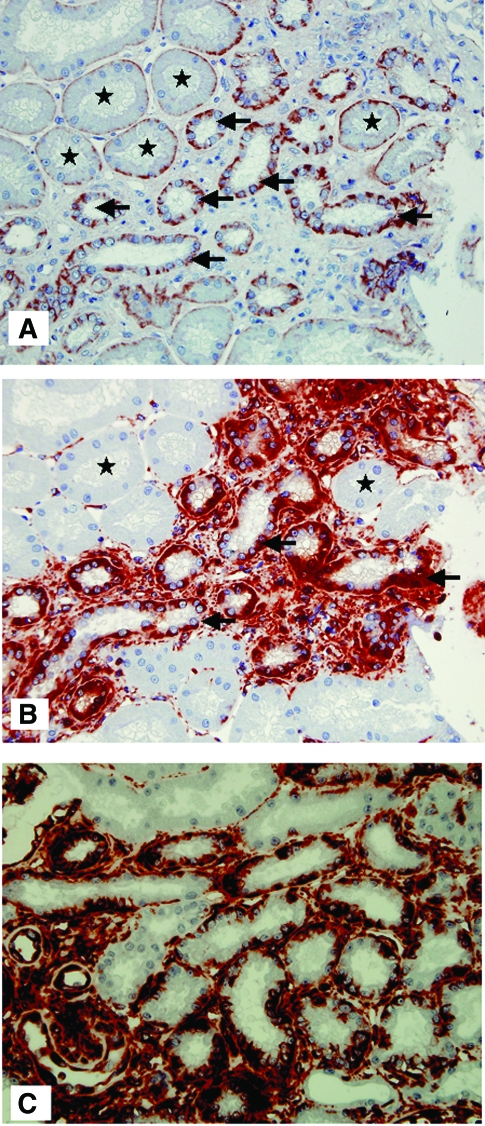
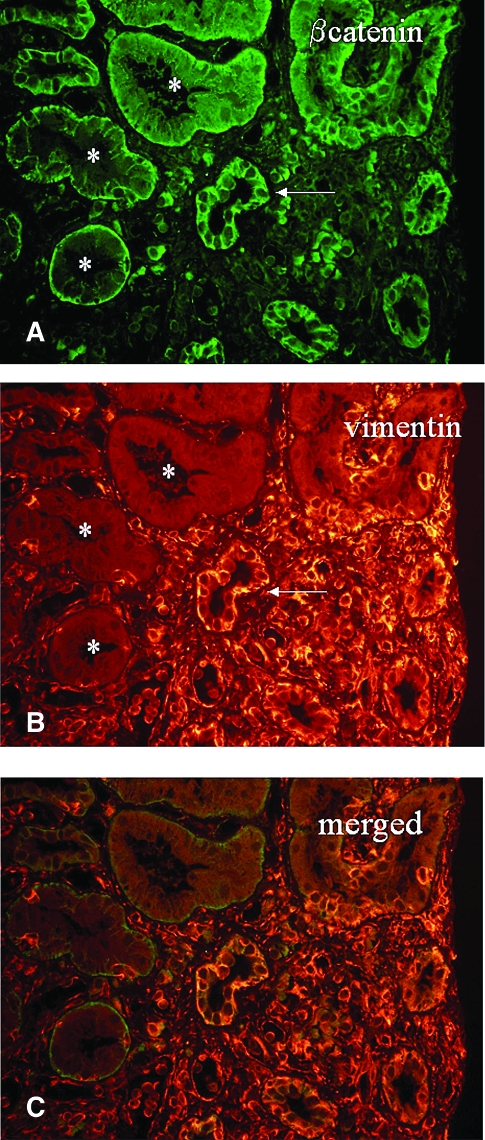
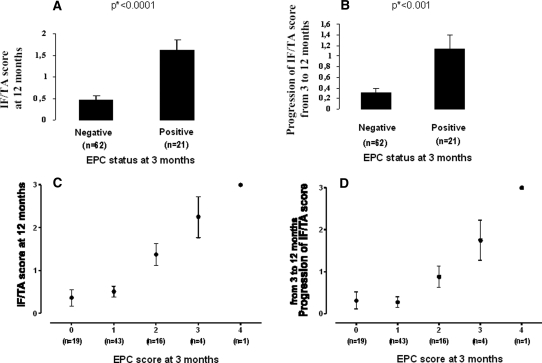
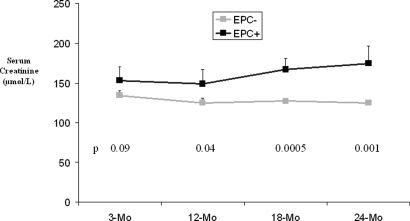
Chronic allograft nephropathy accounts for the loss of approximately 40% of allografts at 10 yr. Currently, no biomarker is available to detect interstitial fibrosis and tubular atrophy in the renal graft at an early stage, when intervention may be beneficial. Because tubular epithelial cells have been shown to exhibit phenotypic changes suggestive of epithelial-to-mesenchymal transition, we studied whether these changes predict the progression of fibrosis in the allograft. Eighty-three kidney transplant recipients who had undergone a protocol graft biopsy at both 3 and 12 mo after transplantation were enrolled. De novo vimentin expression and translocation of beta-catenin into the cytoplasm of tubular cells were detected on the first biopsy by immunohistochemistry. Patients with expression of these markers in >or=10% of tubules at 3 mo had a higher interstitial fibrosis score at 1 yr and a greater progression of this score between 3 and 12 mo. The intensity of these phenotypic changes positively and significantly correlated with the progression of fibrosis, and multivariate analysis showed that their presence was an independent risk factor for this progression. In addition, the presence of early phenotypic changes was associated with poorer graft function 18 mo after transplantation. In conclusion, early phenotypic changes indicative of epithelial-to-mesenchymal transition predict the progression toward interstitial fibrosis in human renal allografts.
Figures
References
-
- Cornell LD, Colvin RB: Chronic allograft nephropathy. Curr Opin Nephrol Hypertens 14: 229–234, 2005 - PubMed
-
- Harris RC, Neilson EG: Toward a unified theory of renal progression. Annu Rev Med 57: 365–380, 2006 - PubMed
-
- Annual report. Agence Biomedecine, Paris, 2006, p 153. Available at: http://www.agence-biomedecine.fr/fr/experts/doc/rapp-synth2006.pdf. Accessed August 20, 2007
-
- Mannon RB: Therapeutic targets in the treatment of allograft fibrosis. Am J Transplant 6: 867–875, 2006 - PubMed
-
- Chapman JR, O'Connell PJ, Nankivell BJ: Chronic renal allograft dysfunction. J Am Soc Nephrol 16: 3015–3026, 2005 - PubMed
Publication types
MeSH terms
LinkOut - more resources
Full Text Sources
Other Literature Sources
Medical
