. 2008 Jul;19(7):2897-906.
doi: 10.1091/mbc.e08-01-0058. Epub 2008 Apr 23.

Global regulation of the interphase microtubule system by abundantly expressed Op18/stathmin

Affiliations

Global regulation of the interphase microtubule system by abundantly expressed Op18/stathmin

Mikael E Sellin et al. Mol Biol Cell. 2008 Jul.

Abstract

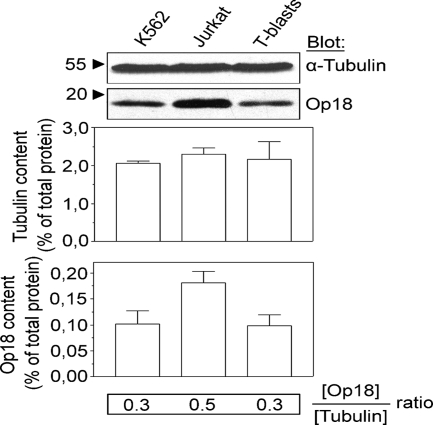
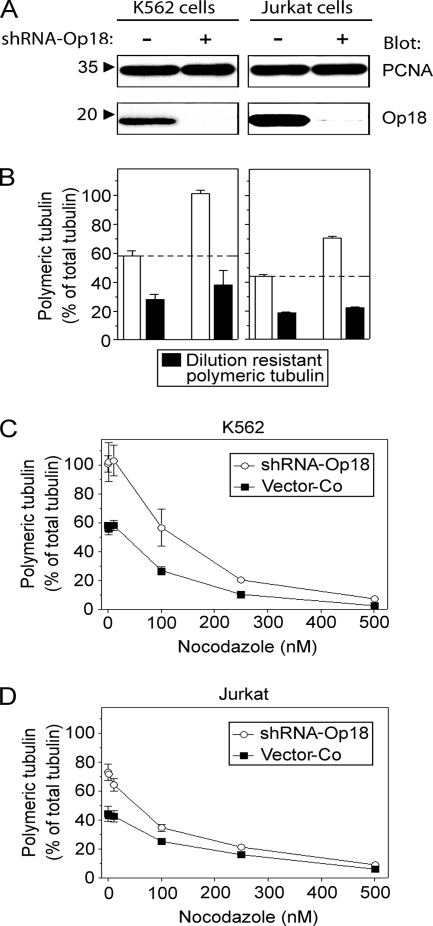
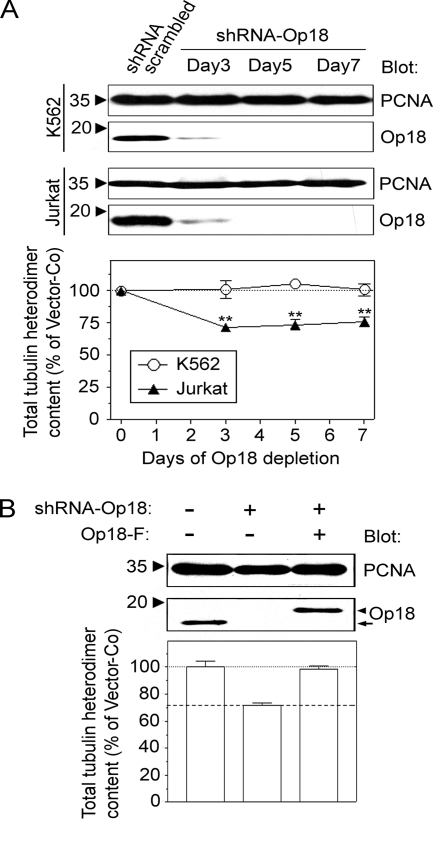
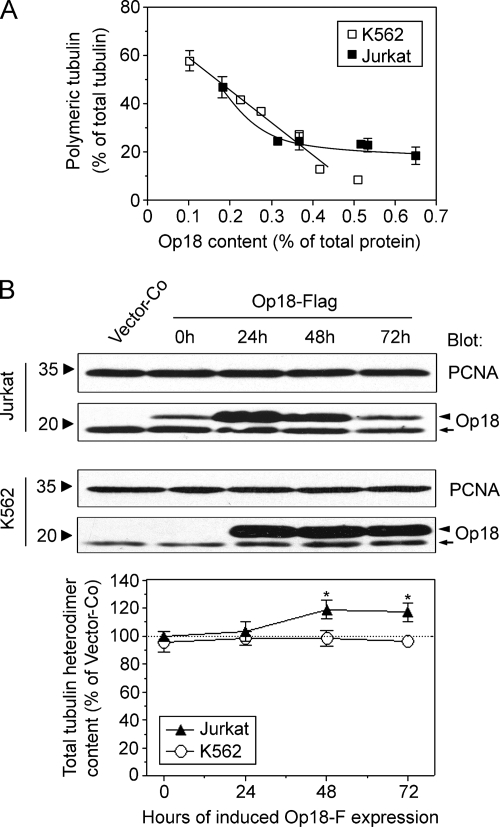
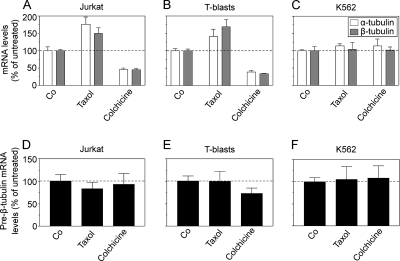
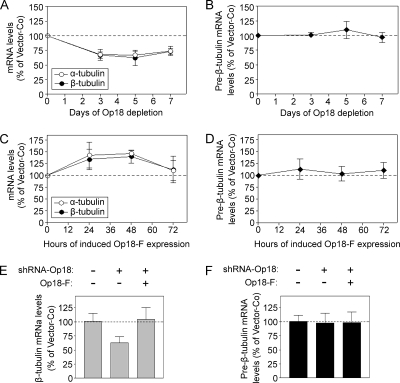
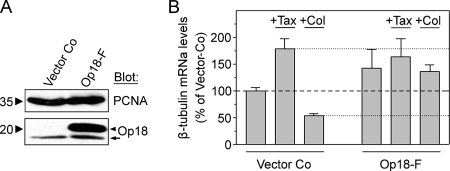
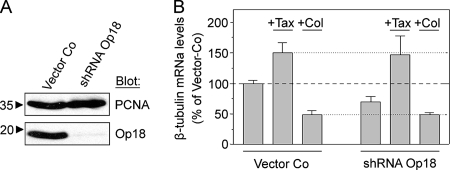
Op18/stathmin (Op18), a conserved microtubule-depolymerizing and tubulin heterodimer-binding protein, is a major interphase regulator of tubulin monomer-polymer partitioning in diverse cell types in which Op18 is abundant. Here, we addressed the question of whether the microtubule regulatory function of Op18 includes regulation of tubulin heterodimer synthesis. We used two human cell model systems, K562 and Jurkat, combined with strategies for regulatable overexpression or depletion of Op18. Although Op18 depletion caused extensive overpolymerization and increased microtubule content in both cell types, we did not detect any alteration in polymer stability. Interestingly, however, we found that Op18 mediates positive regulation of tubulin heterodimer content in Jurkat cells, which was not observed in K562 cells. By analysis of cells treated with microtubule-poisoning drugs, we found that Jurkat cells regulate tubulin mRNA levels by a posttranscriptional mechanism similarly to normal primary cells, whereas this mechanism is nonfunctional in K562 cells. We present evidence that Op18 mediates posttranscriptional regulation of tubulin mRNA in Jurkat cells through the same basic autoregulatory mechanism as microtubule-poisoning drugs. This, combined with potent regulation of tubulin monomer-polymer partitioning, enables Op18 to exert global regulation of the microtubule system.


Figures

Figure 1.
Figure 1.
Quantification of Op18 and tubulin protein content in the K562 and Jurkat cell model systems. Immunoblots of total lysates of K562 cells, Jurkat cells, and normal human exponentially growing T-cells, i.e., T-blasts, by using anti-α-tubulin or anti-Op18 for detection are shown. Quantification (shown at the bottom) was achieved by serial dilution of total lysates and comparison with a standard curve of purified bovine brain tubulin or human recombinant Op18. The data plotted are representative of at least three independent analyses performed in triplicate. T-blasts from three healthy donors were analyzed, and they were found to be indistinguishable regarding Op18 and tubulin levels.
Figure 2.
Figure 2.
Tubulin monomer-polymer partitioning in Op18-depleted cells. K562 and Jurkat cells were transfected as described in Materials and Methods with a replicating shuttle vector that directs synthesis of shRNA designed to target Op18 (shRNA-Op18), or with the empty vector (vector-Co) as indicated. Untransfected cells were counterselected with hygromycin for 5 d. (A) Immunoblots of total lysates of transfected cells obtained by using the indicated antibody for detection. The PCNA protein was used as loading control. Quantification was achieved by serial dilution, which revealed >96% specific depletion of Op18. (B) Levels of polymeric tubulin under standard assay conditions aimed at maintaining steady-state microtubule levels (open bars) and dilution-resistant polymeric tubulin (closed bars) were determined as described in Materials and Methods. Data represent the proportion of polymeric tubulin as a percentage of the total amount of polymerizable tubulin heterodimers, as determined by 2 μg/ml taxol treatment for 1 h. Levels of polymeric tubulin in K562 cells (C) or Jurkat cells (D) were analyzed as in panel B after 2 h in the presence of graded concentrations of the microtubule-destabilizing drug nocodazole. Closed symbols represent vector-Co transfected cells, and open symbols represent cells after 5 d of Op18 depletion. All data are the means of duplicate determinations, and they are representative of at least three independent transfection experiments.
Figure 3.
Figure 3.
Tubulin heterodimer content in Op18-depleted K562 and Jurkat cells. (A) Cells were transfected with shRNA-Op18 or a scrambled shRNA control as in Figure 2, and Op18 depletion was analyzed by immunoblotting at the days indicated. Tubulin heterodimer content of K562 cells (open symbols) or Jurkat cells (closed symbols) was determined in parallel by flow cytometric analysis of paraformaldehyde-fixed and anti-α-tubulin–stained cells and expressed as percentage of the corresponding values for vector-Co transfected cells. (B) Jurkat cells were transfected as indicated either with pMEP vector alone, with shRNA-Op18, or with a mixture of shRNA-Op18 and pMEP-Op18-F, which direct expression of a shRNA-Op18-resistant Flag epitope-tagged Op18 derivative (Op18-Flag) as described in Materials and Methods. Cells were cultured under conditions that allow constitutive expression of ectopic Op18-F from the hMTIIa promoter of the pMEP vector. Top, immunoblots of total cellular lysates and anti-Op18 was used to detect both endogenous Op18 (arrow) and overexpressed Op18-F (arrowhead), and PCNA was used as control for equal loading. Bottom, tubulin heterodimer content determined as described in A. The data in A represent duplicate determinations of four independent transfection experiments. Student's t tests indicated a significant difference from the vector control (p < 0.01). The data in B are representative of two independent transfection experiments.
Figure 4.
Figure 4.
Regulation of tubulin monomer–polymer partitioning and tubulin heterodimer content by overexpressed Op18. Cells were transfected with the replicating shuttle vector pMEP-Op18-F as described in Materials and Methods. After 5 d of culture, Cd2+ was added for 8 h to specifically induce Op18-F from the hMTIIa promoter of the pMEP vector. (A) Total Op18 content (i.e., including both endogenous Op18 and ectopic Op18-F) was quantitated by immunoblotting as in Figure 1 in K562 cells (open symbols) and Jurkat cells (closed symbols) transfected with graded copy numbers of pMEP-Op18-F. Data are plotted as percentage of polymeric tubulin of the total amount of polymerizable tubulin heterodimers, determined in parallel cultures as in Figure 2B, against the estimated total Op18 content. (B) Inducible Op18 expression was analyzed by immunoblotting, and anti-Op18 was used to detect both endogenous Op18 (arrow) and overexpressed Op18-F (arrowhead), and PCNA was used as control for equal loading. The bottom panels show tubulin heterodimer content determined as in Figure 3A. The data are representative of at least three independent transfection experiments, and they are the means of duplicate determinations. Student's t tests in B indicated a significant difference from the vector control (p < 0.05).
Figure 5.
Figure 5.
Posttranscriptional regulation of tubulin mRNAs by taxol and colchicine. Jurkat cells (A and D), normal human T-blasts (B,\ and E), and K562 cells (C and F) were cultured for 5 h in the absence or presence of 3 μg/ml taxol or 1 μg/ml colchicine. Levels of kα1- and β1-tubulin mRNA, and primary β1-tubulin transcripts were determined by quantitative RT-PCR. Tubulin mRNA and the primary transcript were internally normalized relative to GAPDH mRNA levels and plotted as percentage of untreated cells. All data plotted are the means of triplicate determinations, and they are representative of at least four independent experiments.
Figure 6.
Figure 6.
Op18-mediated regulation of tubulin mRNA. Jurkat cells were transfected with vector-Co or shRNA-Op18 (A and B) as in Figure 2, or pMEP-Op18-F (C and D) as in Figure 4. Levels of kα1- and β1-tubulin mRNA, and primary β1-tubulin transcripts were determined by quantitative RT-PCR at the indicated time point after transfection with shRNA-Op18 (A and B) or Cd2+-induced expression of Op18-F (C and D). Tubulin mRNA and the primary transcript were normalized internally relative to GAPDH mRNA levels and plotted as percentage of corresponding values for vector-Co transfected cells. (E and F) Jurkat cells were transfected either with pMEP vector alone, shRNA-Op18, or with a mixture of shRNA-Op18 and pMEP-Op18-F, which direct inducible expression of an shRNA-Op18 resistant Flag epitope-tagged Op18 derivative (Op18-Flag), as described in Materials and Methods. After 5 d of hygromycin selection, Cd2+ was added for 9 h to specifically induce Op18-F from the hMTIIa promoter of the pMEP vector. The levels of β1-tubulin mRNA and primary β1-tubulin transcripts were determined by quantitative RT-PCR, internally normalized relative to GAPDH mRNA levels, and plotted as percentage of corresponding values for vector-Co transfected cells. It should be noted that normalizing the RNA levels relative to total RNA, rather than to GAPDH, did not significantly alter the result presented in this figure (data not shown). All data represent the means of at least three independent transfection experiments in which quantitative RT-PCR was performed either in triplicates (mature mRNA) or as two independent sets of triplicate determinations (primary β1-tubulin transcripts).
Figure 7.
Figure 7.
Excessive Op18 levels block colchicine mediated tubulin mRNA destabilization. Jurkat cells were transfected with replicating shuttle vector-co or pMEP-Op18-F (16 μg) as in Figure 4. Op18-F expression was induced from the hMTIIa promoter for a 12-h period of which taxol or colchicine was present as indicated during the last 5 h. (A) Immunoblot of total lysates of transfected cells before treatment with taxol or colchicine. Anti-Op18 was used to detect both endogenous Op18 (arrow) and overexpressed Op18-F (arrowhead), and PCNA was used as control for equal loading. (B) Levels of β1-tubulin mRNA were determined by quantitative RT-PCR. Tubulin mRNA was normalized internally relative to GAPDH mRNA levels and plotted as percentage of corresponding values for untreated vector-co cells. Normalizing mRNA levels relative to total RNA, rather than to GAPDH, did not significantly alter the result presented in this figure (data not shown). All data are the means of triplicate determinations and are representative of at least three independent transfection experiments.
Figure 8.
Figure 8.
The autoregulatory range defined by the response to taxol and colchicine in control and Op18-depleted cells. Jurkat cells were transfected with vector-co or shRNA-Op18 as described in Figure 2. After 5 d of hygromycin selection, taxol or colchicine was added for 5 h as indicated. (A) Immunoblots of total lysates of transfected cells before treatment with taxol or colchicine by using the indicated antibody for detection. (B) Levels of β1-tubulin mRNA were determined by quantitative RT-PCR as described in Figure 7B. All data are the means of triplicate determinations, and they are representative of at least three independent transfection experiments.

Similar articles

Cited by

References

    1. Bachurski C. J., Theodorakis N. G., Coulson R. M., Cleveland D. W. An amino-terminal tetrapeptide specifies cotranslational degradation of beta-tubulin but not alpha-tubulin mRNAs. Mol. Cell Biol. 1994;14:4076–4086. - PMC - PubMed
    1. Barlow S. B., Gonzalez-Garay M. L., Cabral F. Paclitaxel-dependent mutants have severely reduced microtubule assembly and reduced tubulin synthesis. J. Cell Sci. 2002;115:3469–3478. - PubMed
    1. Belmont L. D., Mitchison T. J. Identification of a protein that interacts with tubulin dimers and increases the catastrophe rate of microtubules. Cell. 1996;84:623–631. - PubMed
    1. Boggs B., Cabral F. Mutations affecting assembly and stability of tubulin: evidence for a nonessential beta-tubulin in CHO cells. Mol. Cell Biol. 1987;7:2700–2707. - PMC - PubMed
    1. Brattsand G., Roos G., Marklund U., Ueda H., Landberg G., Nanberg E., Sideras P., Gullberg M. Quantitative analysis of the expression and regulation of an activation-regulated phosphoprotein (oncoprotein 18) in normal and neoplastic cells. Leukemia. 1993;7:569–579. - PubMed

Publication types

LinkOut - more resources