

Hospital multifactor productivity: a presentation and analysis of two methodologies
Affiliations
- PMID: 18435223
- PMCID: PMC4195020
Item in Clipboard
Hospital multifactor productivity: a presentation and analysis of two methodologies
Health Care Financ Rev.
2007.
Abstract
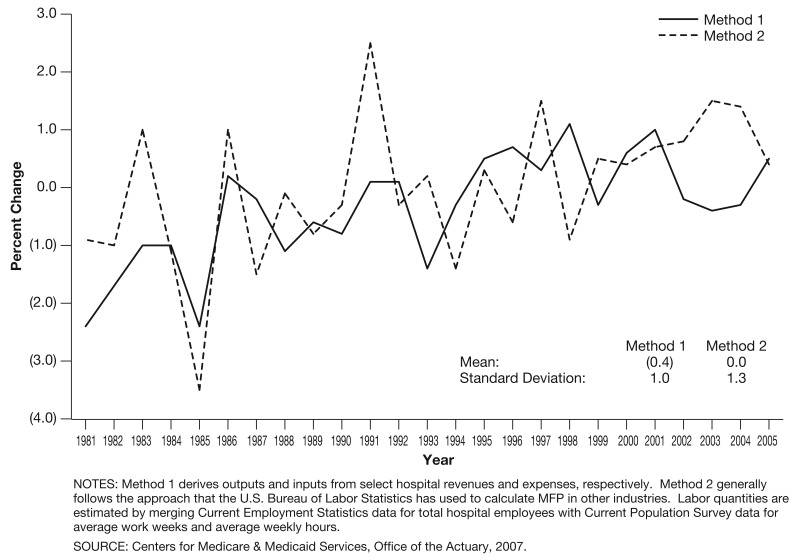
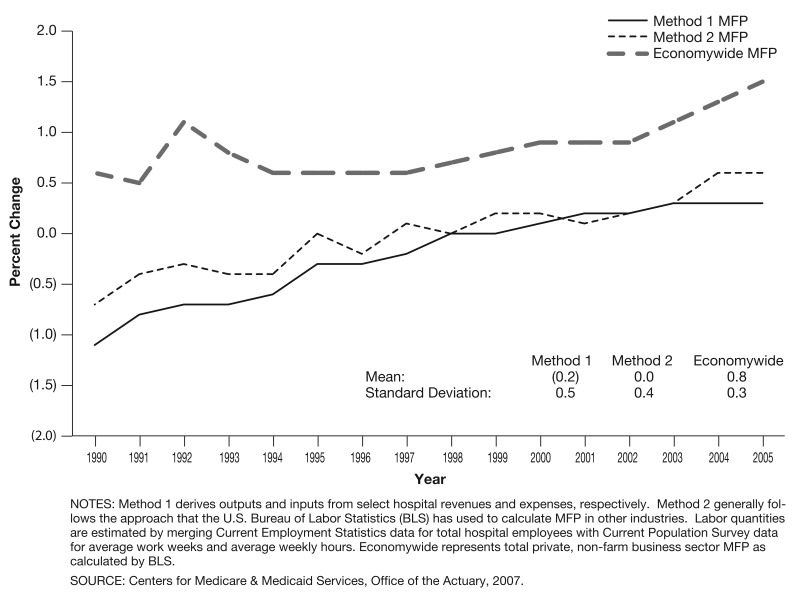
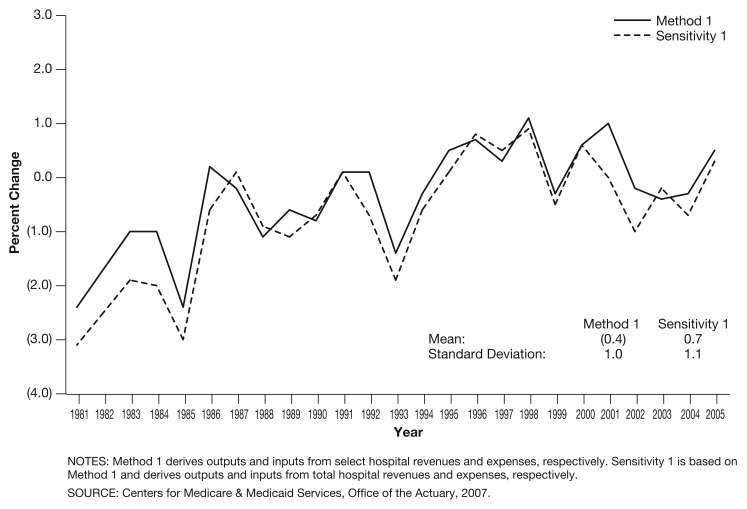
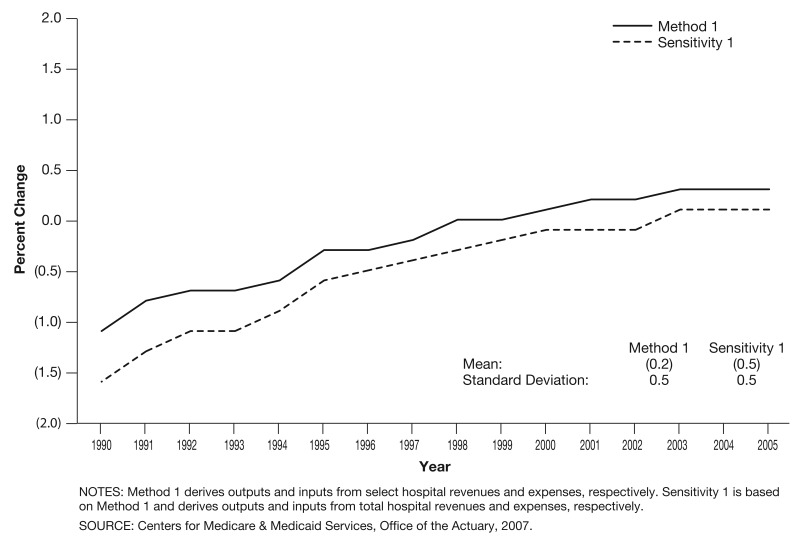
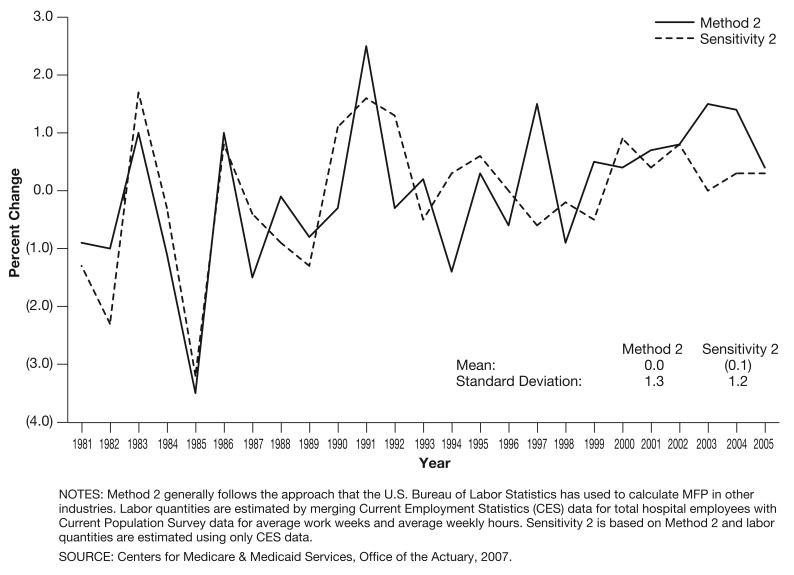
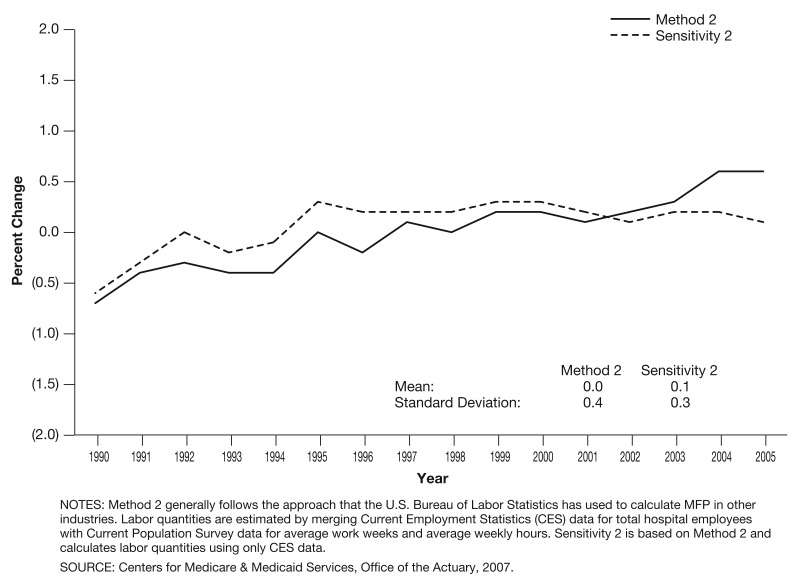
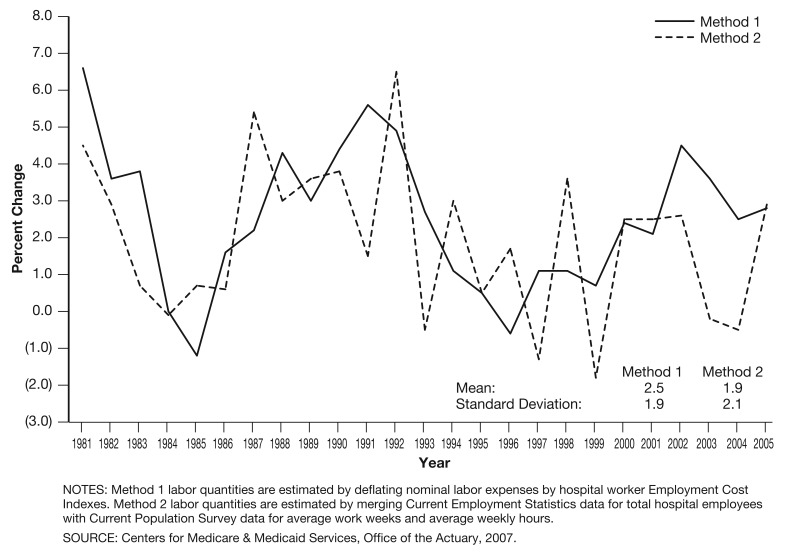
In response to recent discussions regarding the ability of hospitals to achieve gains in productivity, we present two methodologies that attempt to measure multifactor productivity (MFP) in the hospital sector. We analyze each method and conclude that the inconsistencies in their outcomes make it difficult to estimate a precise level of MFP that hospitals have historically achieved. Our goal in developing two methodologies is to inform the debate surrounding the ability of hospitals to achieve gains in MFP, as well as to highlight some of the challenges that exist in measuring hospital MFP.
Figures
Similar articles
-
Multifactor productivity in physicians' offices: an exploratory analysis.Health Care Financ Rev. 2007-2008 Winter;29(2):15-32. Health Care Financ Rev. 2007. PMID: 18435220 Free PMC article.
-
Multifactor productivity in health care.Health Care Financ Rev. 2007-2008 Winter;29(2):1-4. Health Care Financ Rev. 2007. PMID: 18435218 Free PMC article.
-
The impact of policy on hospital productivity: a time series analysis of Dutch hospitals.Health Care Manag Sci. 2014 Jun;17(2):139-49. doi: 10.1007/s10729-013-9257-8. Epub 2013 Nov 21. Health Care Manag Sci. 2014. PMID: 24258183
-
Productivity adjustment in the Medicare physician fee schedule update.Health Care Financ Rev. 2007-2008 Winter;29(2):5-14. Health Care Financ Rev. 2007. PMID: 18435219 Free PMC article. Review.
-
Improving hospital performance: culture change is not the answer.Healthc Q. 2005;8(2):60-6. doi: 10.12927/hcq..17096. Healthc Q. 2005. PMID: 15828569 Review.
Cited by
-
Is Annual Preoperative Utilization an Indicator of Postoperative Surgical Outcomes? A Study in Medicare Expenditure.World J Surg. 2020 Jan;44(1):108-114. doi: 10.1007/s00268-019-05184-8. World J Surg. 2020. PMID: 31531723
-
Hospital Productivity After Data Breaches: Difference-in-Differences Analysis.J Med Internet Res. 2021 Jul 6;23(7):e26157. doi: 10.2196/26157. J Med Internet Res. 2021. PMID: 34255672 Free PMC article.
-
The end of hospital cost shifting and the quest for hospital productivity.Health Serv Res. 2014 Feb;49(1):1-10. doi: 10.1111/1475-6773.12105. Epub 2013 Sep 16. Health Serv Res. 2014. PMID: 24102445 Free PMC article. No abstract available.
-
Complementary effect of patient volume and quality of care on hospital cost efficiency.Health Care Manag Sci. 2017 Jun;20(2):221-231. doi: 10.1007/s10729-015-9348-9. Epub 2015 Dec 4. Health Care Manag Sci. 2017. PMID: 26637297
-
Health system productivity in sub-Saharan Africa: tuberculosis control in high burden countries.Cost Eff Resour Alloc. 2023 Nov 25;21(1):90. doi: 10.1186/s12962-023-00485-1. Cost Eff Resour Alloc. 2023. PMID: 38007522 Free PMC article.
References
-
- Ashby J, Guterman S, Greene T. An Analysis of Hospital Productivity and Product Change. Health Affairs. 2000 Sep-Oct;19(5):197–205. - PubMed
-
- Baumol WJ, Bowen WG. Performing Arts: The Economic Dilemma. New York: 1966.
-
- Bowler M, Morisi TL. Understanding the Employment Measures from the CPS and CES Survey. Monthly Labor Review. 2006 Feb;129(2):23–38.
MeSH terms
LinkOut - more resources
Full Text Sources