Review
. 2008 Jul;32(4):557-78.
doi: 10.1111/j.1574-6976.2008.00111.x. Epub 2008 Apr 22.

Species divergence and the measurement of microbial diversity

Affiliations
Review

Species divergence and the measurement of microbial diversity

Catherine A Lozupone et al. FEMS Microbiol Rev. 2008 Jul.

Abstract

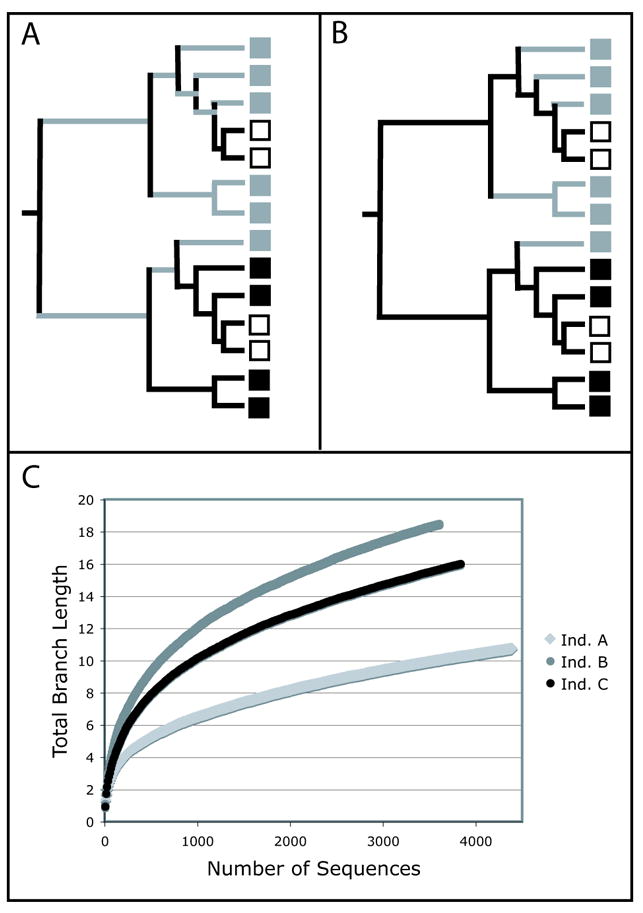
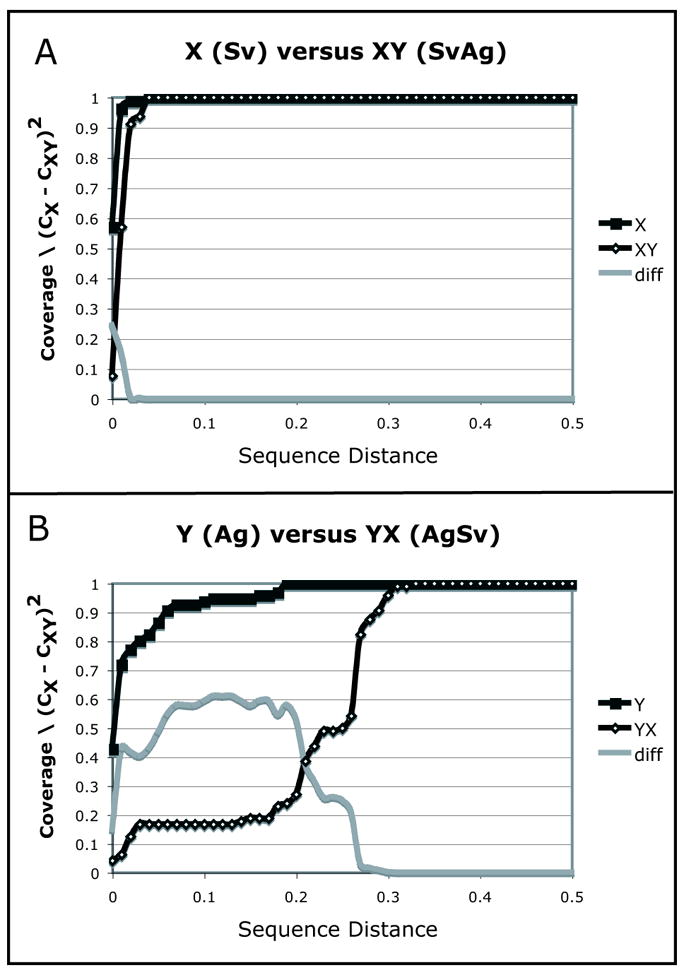
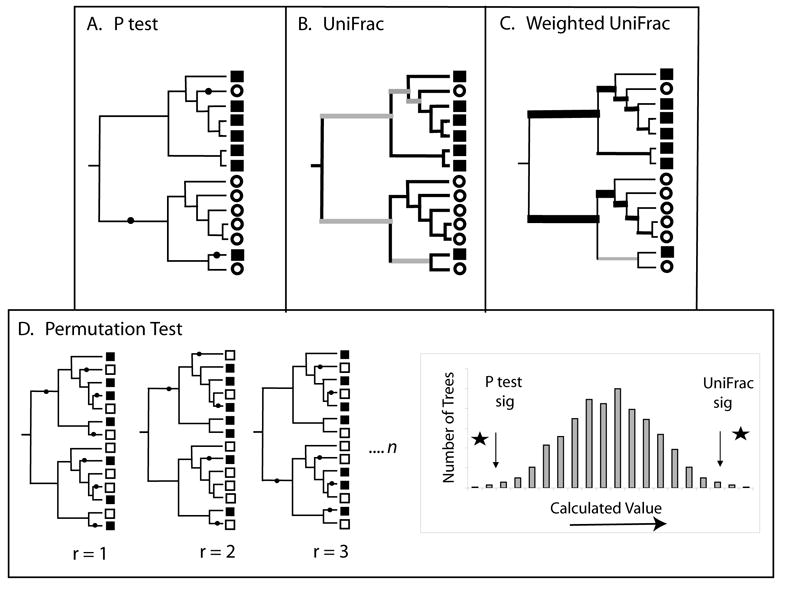
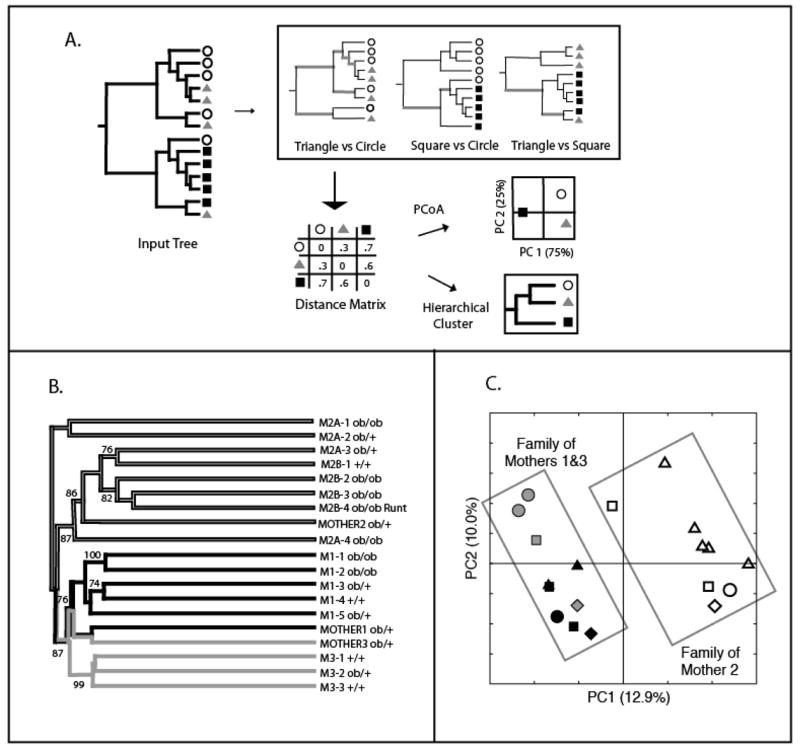
Diversity measurement is important for understanding community structure and dynamics, but has been particularly challenging for microorganisms. Microbial community characterization using small subunit rRNA (SSU rRNA) gene sequences has revealed an extensive, previously unsuspected diversity that we are only now beginning to understand, especially now that advanced sequencing technologies are producing datasets containing hundreds of thousands of sequences from hundreds of samples. Efforts to quantify microbial diversity often use taxon-based methods that ignore the fact that not all species are equally related, which can therefore obscure important patterns in the data. For example, alpha-diversity (diversity within communities) is often estimated as the number of species in a community (species richness), and beta-diversity (partitioning of diversity among communities) is often based on the number of shared species. Methods for measuring alpha- and beta-diversity that account for different levels of divergence between individuals have recently been more widely applied. These methods are more powerful than taxon-based methods because microorganisms in a community differ dramatically in sequence similarity, which also often correlates with phenotypic similarity in key features such as metabolic capabilities. Consequently, divergence-based methods are providing new insights into microbial community structure and function.


Figures

Figure 1
Figure 1
Estimates of Phylogenetic Diversity (PD) and PD Gain (G) for the grey community. The boxes represent taxa from the black, white, and grey communities. (A) PD is the sum of the branches leading to the grey taxa. (B) G is the sum of the branches leading only to the grey taxa. (C) PD rarefaction curves showing the increase in branch length with sampling effort for the intestinal and stool bacteria from three healthy individuals. Aligned16S rRNA sequences from the three individuals were available with the Supplementary Materials in (Eckburg, et al., 2005). The Arb parsimony insertion tool was used to add the sequences to a tree containing over 9,000 sequences (Hugenholtz, 2002) that is available for download at the rRNA Database Project II website (Maidak, et al., 2001). The curves represent the average values for 50 replicate trials.
Figure 2
Figure 2
A LibShuff comparison of bacterial 16S rRNA clones from the guts of two wood-boring beetles in the Cerambycidae, S. vestida (X) and A. glabripennis (Y). The sequence data was initially described in (Schloss, et al., 2006). We downloaded the 180 sequences that were deposited in Genbank by the authors, aligned them with the NAST alignment tool (DeSantis, et al., 2006), and used ARB (Ludwig, et al., 2004) to apply a lanemask to exclude hypervariable regions that were not well aligned. We removed 5 short sequences to maximize the region of overlapping sequence reads. A matrix of sequence distances was generated using the Phylip dnadist program with the Jukes-Cantor model of nucleotide substitution. The LibShuff analysis was performed on this distance matrix using the webLIBSHUFF implementation (Henriksen, 2004). The homologous coverage curve (■) represents only S. vestida in panel A and only A. glabripennis in panel B. It shows how the number of groups changes throughout the range of sequence distances. The heterologous coverage curve (◇) shows the percent of groups that the other beetle shares with the first beetle over the range of sequence distances. The solid grey line is the value of (CX − CXY)2 at each level of evolutionary distance. The area under this curve is the raw LibShuff value.
Figure 3
Figure 3
Significance testing with the P test, UniFrac, and weighted UniFrac. The P test and the unweighted and weighted UniFrac significance tests all determine whether two communities are significantly different by comparing a value for the true tree to a collection of random trees and/or trees in which the community labels have been randomly assigned to a constant tree topology. For the P test (A), the calculated value is the minimum number of changes (indicated with black dots) needed to describe the distribution of community labels on a phylogenetic tree (squares and circles denote sequences derived from different communities). For UniFrac (B), the calculated value is the fraction of branch length in the tree that is unique to one community (black branches) verses shared (grey branches). For weighted UniFrac (C), the calculated value is the sum of the branches weighted by the difference in the number of descendants from each community for each branch (represented here by the thickness of the branch). (D) For the P test, the p value is the fraction of the random trees that have a smaller value then the real tree. For both unweighted and weighted UniFrac, the p value is the fraction of the random trees that have a greater value than the real tree.
Figure 4
Figure 4
Clustering with UniFrac. (A) Schematic showing how clustering is performed, adapted from (Lozupone & Knight, 2005). The circles, squares, and triangles represent sequences from three different communities. The UniFrac value is calculated for all pairs of communities, and the resulting distance matrix can be used to cluster the samples using Principal Coordinates Analysis (PCoA) or hierarchical clustering. (B) The results of hierarchical clustering and jackknifing of cecal microbial communities from three mother mice (MOTHER1-3) and their offspring (M1-, M2A-, M2B-, and M3) with unweighted UniFrac (Adapted from (Ley, et al., 2005, Lozupone, et al., 2007)). Genotypes are ob/ob for homozygotes for the mutant leptin allele that confers obesity, ob/+ for heterozygotes, and +/+ for wild-types. The percentage support for nodes supported at least 70% of the time with sequence jackknifing with a maximum of 200 sequences from each mouse for 100 replicates is indicated. The main clustering is by mother. (C) Plot of the first 2 principal coordinates axes for PCoA with unweighted UniFrac. Symbols represent individual animals. The rectangles highlight the family of Mother 2 (open symbols), and the families of Mothers 1 and 3 (grey and black symbols), who are sisters.
Figure 5
Figure 5
Ordination of human stool and intestinal mucosal samples with DPCoA and UniFrac. (A) Ordination of samples with DPCoA (adapted from (Eckburg, et al., 2005)). Axis 1 separates the mucosal samples of individual B from individuals A and C and Axis 2 separates the stool and mucosal samples. (B) PCoA of weighted UniFrac values (adapted from (Ley, et al., 2005)). The results are almost identical to the DPCoA results from A. (C) PCoA of unweighted UniFrac values (adapted from (Ley, et al., 2005)). Unlike for weighted UniFrac and DPCoA, the stool samples from each individual clusters with the mucosal samples from that individual, indicating that the difference between the stool and mucosal samples is in the relative abundance of lineages rather than which lineages are present. (D) Position of sequences in the same coordinate space used to plot the samples in A. This suggests that the abundance of members of the Prevotellae family in Individual B contributes to the difference with Individuals A and C. (E) PCoA of unweighted UniFrac values calculated from an ARB parsimony insertion tree made with 100 bp sequence regions extending from PCR primer R357 (adapted from (Liu, et al., 2007)). Even with these short sequence reads, UniFrac recaptured the result from the near-full length 16S rRNA sequences.

References

    1. Bass-Becking LGM. Geobiologie of Inleiding tot de Milieukunde. 1934. W.p van Stockum & Zoon N.V.
    1. Beman JM, Francis CA. Diversity of ammonia-oxidizing archaea and bacteria in the sediments of a hypernutrified subtropical estuary: Bahia del Tobari, Mexico. Appl Environ Microbiol. 2006;72:7767–7777. - PMC - PubMed
    1. Bik EM, Eckburg PB, Gill SR, et al. Molecular analysis of the bacterial microbiota in the human stomach. Proc Natl Acad Sci USA. 2006;103:732–737. - PMC - PubMed
    1. Binladen J, Gilbert MT, Bollback JP, Panitz F, Bendixen C, Nielsen R, Willerslev E. The use of coded PCR primers enables high-throughput sequencing of multiple homolog amplification products by 454 parallel sequencing. PLoS ONE. 2007;2:e197. - PMC - PubMed
    1. Bohannan BJ, Hughes J. New approaches to analyzing microbial biodiversity data. Curr Opin Microbiol. 2003;6:282–287. - PubMed

Publication types