

Atrophy measurement of the anterior commissure and substantia innominata with 3T high-resolution MR imaging: does the measurement differ for patients with frontotemporal lobar degeneration and Alzheimer disease and for healthy subjects?
- PMID: 18436612
- PMCID: PMC8119142
- DOI: 10.3174/ajnr.A1103
Atrophy measurement of the anterior commissure and substantia innominata with 3T high-resolution MR imaging: does the measurement differ for patients with frontotemporal lobar degeneration and Alzheimer disease and for healthy subjects?
Abstract
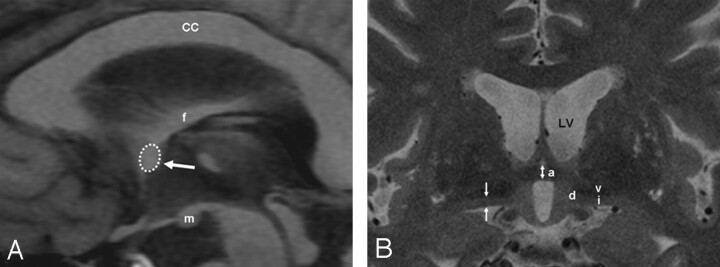
Background and purpose: The anterior commissure (AC) and substantia innominata (SI) can be clearly demonstrated at 3T high-resolution MR imaging. Our aim was to investigate if atrophy of the AC and SI on 3T MR imaging differs among patients with frontotemporal lobar degeneration (FTLD) and Alzheimer dementia (AD) and healthy subjects.
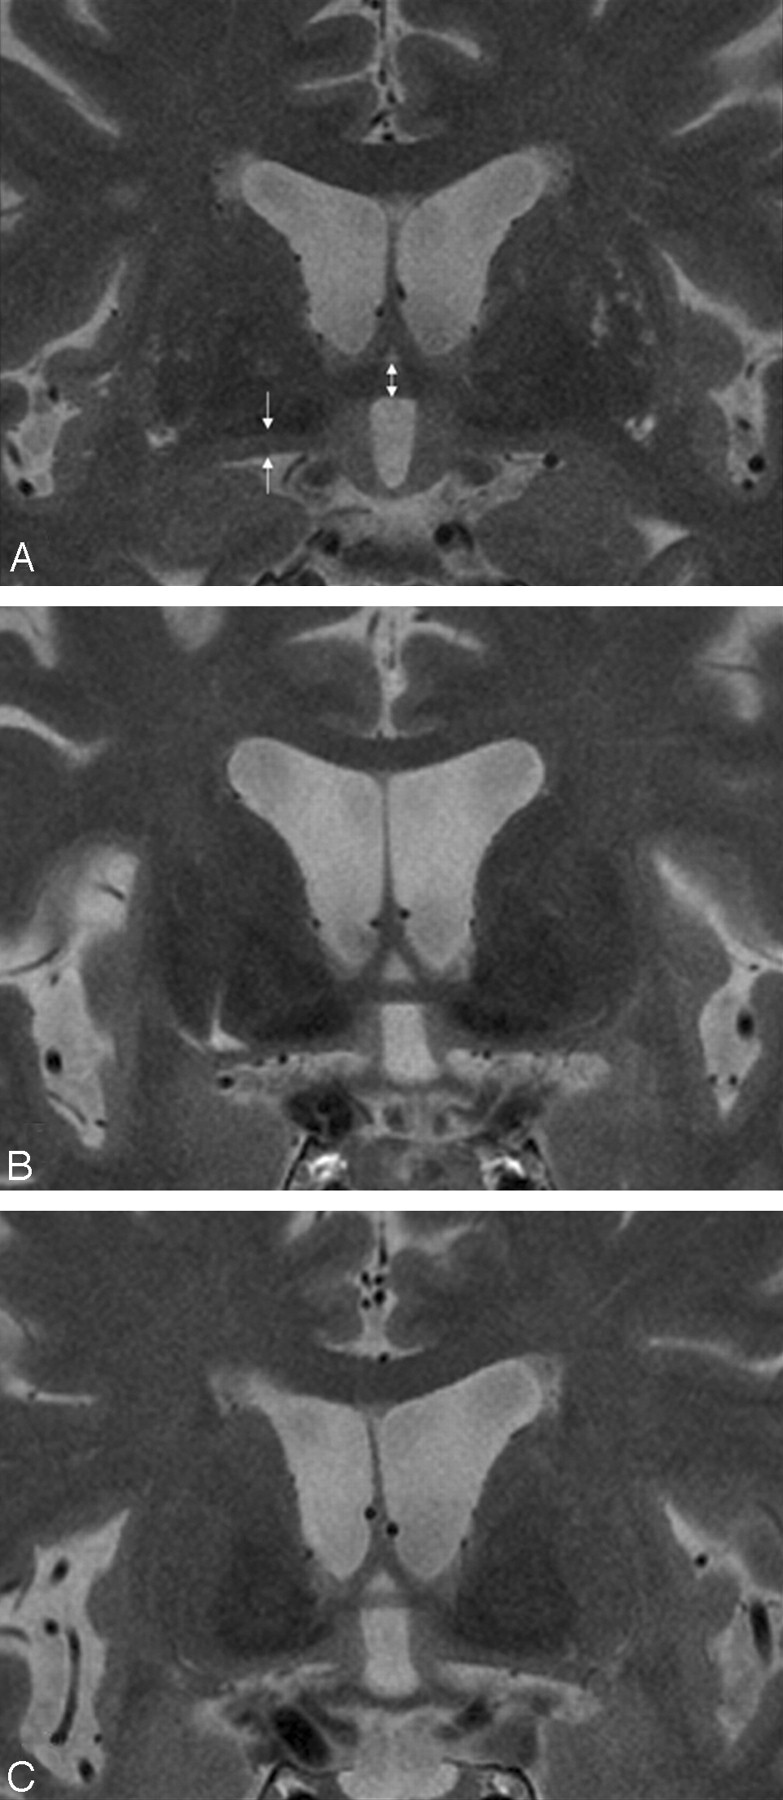
Materials and methods: Seven consecutive patients with FTLD, 20 patients with AD, and 16 age-matched control subjects were enrolled. MR imaging was performed at 3T. The AC thickness as well as the SI thickness was measured on a thin-section coronal T2-weighted image, and the AC area was measured on a sagittal T1-weighted image. The measurement differences among the participants were analyzed with the Kruskal-Wallis test. A correlation of the measurement with the Mini-Mental State Examination (MMSE) score was obtained with the Spearman rank correlation test.
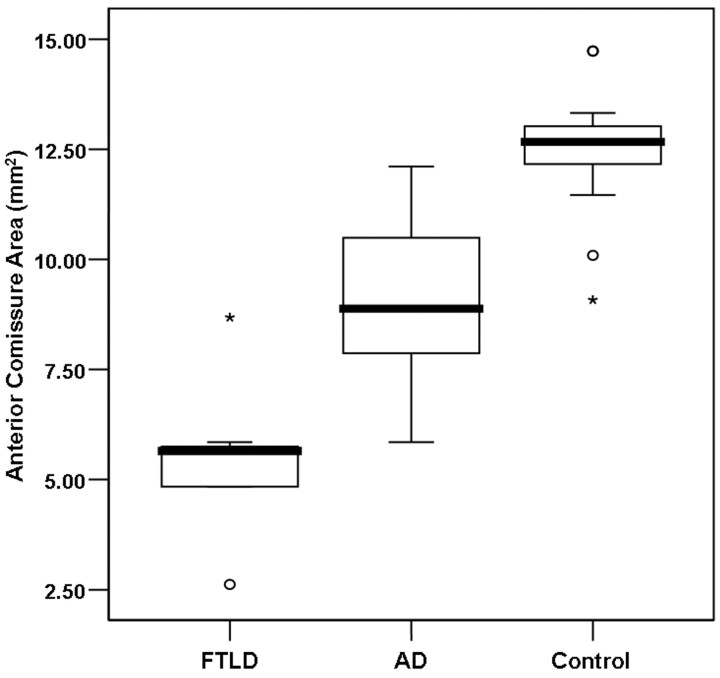
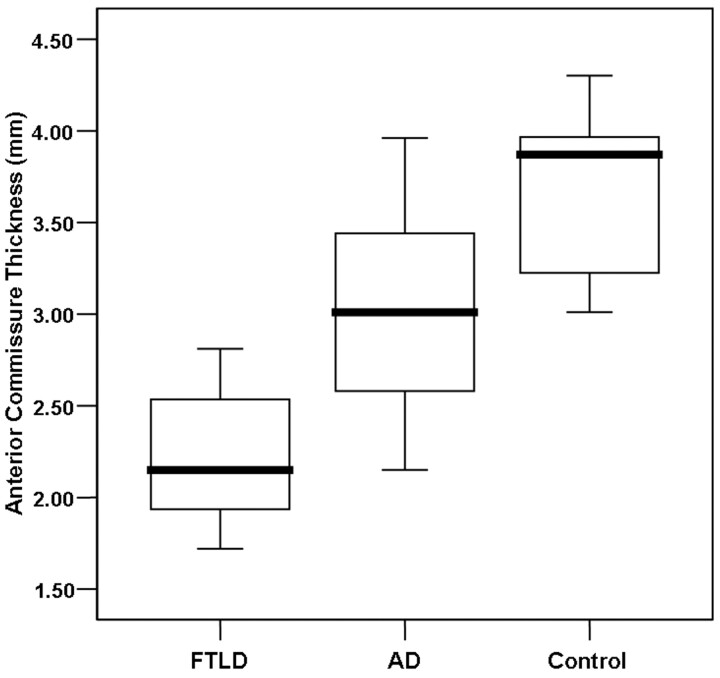
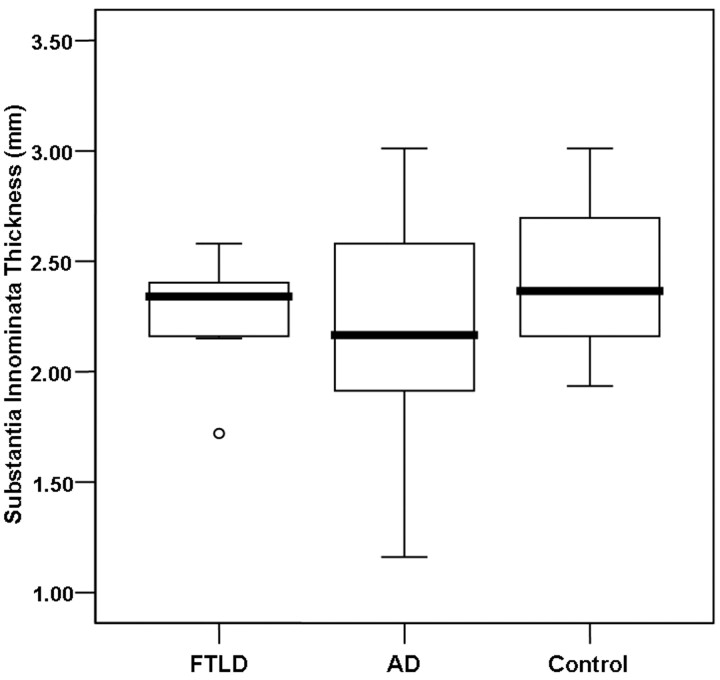
Results: Thinning of the AC was significantly more prominent in FTLD than in AD (P < .001). Although the right SI thickness was significantly decreased in patients with AD as compared with control subjects (P < .05), there was no significant difference, with a substantial overlap of the average SI thickness among the 3 groups. The thickness and the area of the AC were positively correlated with the MMSE score (rho = 0.612, P < .001, and rho = 0.659, P < .001, respectively). In contrast, the average SI thickness showed a weak positive correlation with the MMSE score (rho = 0.325, P < .05).
Conclusion: Measurement of AC atrophy with 3T MR imaging may provide additional diagnostic clues for FTLD and AD. Conversely, SI atrophy measurement does not provide an additional benefit in the evaluation of FTLD and AD, owing to a considerable overlap in the average thickness of bilateral SI.
Figures
References
-
- Neary D, Snowden JS, Gustafson L, et al. Frontotemporal lobar degeneration: a consensus on clinical diagnostic criteria. Neurology 1998;51:1546–54 - PubMed
-
- Goldman JS, Farmer JM, Wood EM, et al. Comparison of family histories in FTLD subtypes and related tauopathies. Neurology 2005;65:1817–19 - PubMed
-
- Roberson ED, Hesse JH, Rose KD, et al. Frontotemporal dementia progresses to death faster than Alzheimer disease. Neurology 2005;65:719–25 - PubMed
-
- Rabinovici GD, Furst AJ, O’Neil JP, et al. 11C-PIB PET imaging in Alzheimer disease and frontotemporal lobar degeneration. Neurology 2007;68:1205–12 - PubMed
-
- Perry RJ, Miller BL. Behavior and treatment in frontotemporal dementia. Neurology 2001;56:S46–51 - PubMed
Publication types
MeSH terms
LinkOut - more resources
Full Text Sources
Other Literature Sources
Medical