. 2008 May 9;4(4):e1000064.
doi: 10.1371/journal.pcbi.1000064.

Implementing arithmetic and other analytic operations by transcriptional regulation

Affiliations

Implementing arithmetic and other analytic operations by transcriptional regulation

Sean M Cory et al. PLoS Comput Biol. .

Abstract

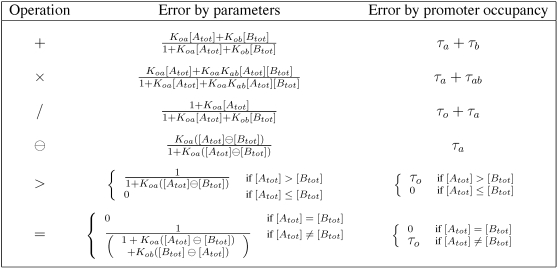
The transcriptional regulatory machinery of a gene can be viewed as a computational device, with transcription factor concentrations as inputs and expression level as the output. This view begs the question: what kinds of computations are possible? We show that different parameterizations of a simple chemical kinetic model of transcriptional regulation are able to approximate all four standard arithmetic operations: addition, subtraction, multiplication, and division, as well as various equality and inequality operations. This contrasts with other studies that emphasize logical or digital notions of computation in biological networks. We analyze the accuracy and precision of these approximations, showing that they depend on different sets of parameters, and are thus independently tunable. We demonstrate that networks of these "arithmetic" genes can be combined to accomplish yet more complicated computations by designing and simulating a network that detects statistically significant elevations in a time-varying signal. We also consider the much more general problem of approximating analytic functions, showing that this can be achieved by allowing multiple transcription factor binding sites on the promoter. These observations are important for the interpretation of naturally occurring networks and imply new possibilities for the design of synthetic networks.


Conflict of interest statement

The authors have declared that no competing interests exist.

Figures

Figure 1
Figure 1. Schematic of a chemical model of a gene regulated by two transcription factors.
Transcription factors A and B may irreversibly form an inert dimer, C, or they may bind individually or simultaneously to the promoter region of the gene, where they affect the transcription rate. Transcripts, T, are translated into proteins, Z. Both T and Z decay at fixed rates.
Figure 2
Figure 2. Regulatory architectures and parameters for approximating various arithmetic and comparison operations.
(A) Diagrams depict the reactions employed to achieve each operation. The AB dumbbell is bold if A and B dimerize and gray if they do not. The four circles connected as a diamond represent different binding states of the promoter. In bold are achievable binding states, with bold connecting bars indicating the allowed transitions. A bold arrow leaving a circle to the right indicates a binding state in which transcription occurs. (B) Steady state expression and parameter constraints. Each row of the table corresponds to one operation. The [Z] column gives the exact and approximate steady-state expression of the gene. The exact steady state is obtained from Equation (24), assuming parameters conform to the formulae in the “Production-decay balance” column and setting to zero those parameters implied to be zero by the diagrams in (A). The final column of the table describes under what conditions each operation is well approximated. The symbol ⊝ denotes zero-truncated subtraction, defined as xy = max(xy, 0).
Figure 3
Figure 3. Accuracy with which the genetic designs in Figure 2 approximate the intended operations.
We quantify accuracy in terms of relative error—|f([Atot],[Btot])−[Z]|/f([Atot],[Btot]) for the arithmetic operations, and |f([Atot],[Btot])−[Z]|/Zon for the comparison operations, where f is the operation being approximated. The second column in the table gives relative error in terms of the kinetic parameters. The third column gives the relative error in terms of the fraction of time the promoter spends bound by different combinations of transcription factors at steady state.
Figure 4
Figure 4. Stochastic kinetics simulation of an Addition gene, for varying rates of transcription factor binding and unbinding.
Larger values of ρ correspond to both faster binding and unbinding, with no change in the equilibrium association constant. (A) Sample traces of the output, Z(t). (B) Empirical noise (standard deviation divided by mean) in the output. Dashed line gives the expected noise under the steady state assumption for the promoter. (C) Mean output, which is independent of ρ. See Materials and Methods for details, including kinetic parameters.
Figure 5
Figure 5. (A) Diagram of a network of arithmetic genes that computes the mean and standard deviation of a time-varying signal, I(t), and responds when the signal is statistically significantly elevated.
Circles represent genes. An arrow between genes Gi and Gj means that Gi's protein is an input to (transcription factor for) Gj. Symbols inside the circles denote the operation computed. μ denotes a gene that is activated proportional to its input, but operates at a slower time scale than the other genes, resulting in a recency-weighted temporal average of its input. (B–E) Simulation results. (B) The input signal is primarily a sinusoidal oscillation with Gaussian noise added. The mean changes on days 8 and 11, and the amplitude changes on day 14. There are short spikes in the signal on days 5, 6, 7, 17, 18 and 19. See Materials and Methods for details. An “X” marks each time the signal is significantly elevated compared to its recent mean and standard deviation. (C) The overall response of the network is given by the expression level of gene G8. It correctly flags each significant elevation of the signal and does not respond at any other time. The responses to the input spikes do not last long because the spikes themselves do not last long. The responses to the changes in the oscillations on days 8 and 14 are short because the network quickly adjusts to the changed statistics of the input signal. (D,E) The mean and standard deviation of the sinusoidal oscillations, and the network's recency-weighted estimates of the mean and standard deviation of the signal, as encoded by the concentrations of the proteins for genes G3 and G6.
Figure 6
Figure 6. Approximation of analytic function.
(A) Schematic of interactions for a gene regulated by a single transcription factor, A, via N independent binding sites. (B) For varying input levels, [A], the four curves represent: cos([A]), the 5th order Taylor series approximation of cosine centered at zero, the steady state output ([Z]) of a pair of genes computing the Taylor series approximation to cosine, and the steady state output when kinetic rates are optimized so that [Z]≈cos([A]), over the range [A]∈[0,2π] nM.

References

    1. Arkin AP. Signal processing in biochemical reaction networks. In: Walleczek J, editor. Self-Organized Biological Dynamics and Nonlinear Control. Cambridge University Press; 2000.
    1. Regev A, Shapiro E. Cells as computation. Nature. 2002;419:343. - PubMed
    1. Guet CC, Elowitz MB, Hsing W, Leibler S. Combinatorial synthesis of genetic networks. Science. 2002;296:1466–1479. - PubMed
    1. Setty Y, Mayo AE, Surette MG, Alon U. Detailed map of a cis-regulatory input function. Proc Natl Acad Sci U S A. 2003;100:7702–7707. - PMC - PubMed
    1. Mayo AE, Setty Y, Shavit S, Zaslaver A, Alon U. Plasticity of the cis-regulatory input function of a gene. PLoS Biol. 2006;4:e45. - PMC - PubMed

Publication types

MeSH terms

Substances