

Modulation of temporally coherent brain networks estimated using ICA at rest and during cognitive tasks
- PMID: 18438867
- PMCID: PMC2649823
- DOI: 10.1002/hbm.20581
Modulation of temporally coherent brain networks estimated using ICA at rest and during cognitive tasks
Abstract
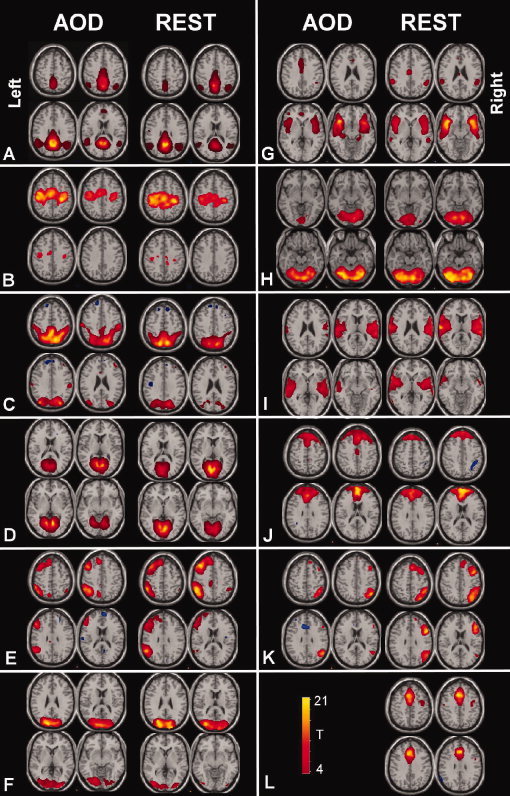
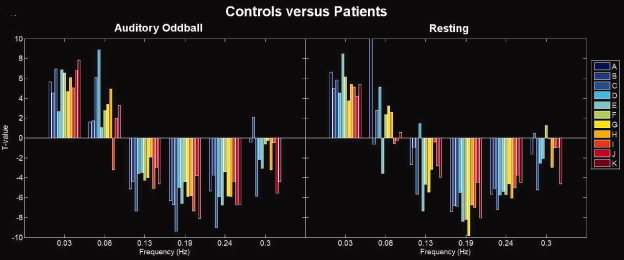
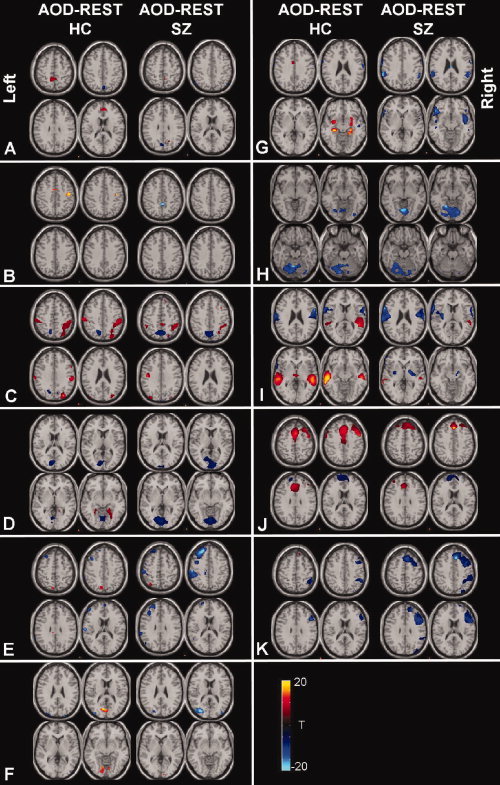
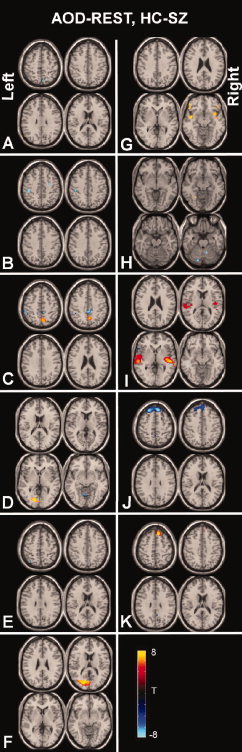
Brain regions which exhibit temporally coherent fluctuations, have been increasingly studied using functional magnetic resonance imaging (fMRI). Such networks are often identified in the context of an fMRI scan collected during rest (and thus are called "resting state networks"); however, they are also present during (and modulated by) the performance of a cognitive task. In this article, we will refer to such networks as temporally coherent networks (TCNs). Although there is still some debate over the physiological source of these fluctuations, TCNs are being studied in a variety of ways. Recent studies have examined ways TCNs can be used to identify patterns associated with various brain disorders (e.g. schizophrenia, autism or Alzheimer's disease). Independent component analysis (ICA) is one method being used to identify TCNs. ICA is a data driven approach which is especially useful for decomposing activation during complex cognitive tasks where multiple operations occur simultaneously. In this article we review recent TCN studies with emphasis on those that use ICA. We also present new results showing that TCNs are robust, and can be consistently identified at rest and during performance of a cognitive task in healthy individuals and in patients with schizophrenia. In addition, multiple TCNs show temporal and spatial modulation during the cognitive task versus rest. In summary, TCNs show considerable promise as potential imaging biological markers of brain diseases, though each network needs to be studied in more detail.
(c) 2008 Wiley-Liss, Inc.
Figures
References
-
- Andreasen NC,Paradiso S,O'Leary DS ( 1998): Cognitive dysmetria as an integrative theory of schizophrenia: A dysfunction in cortical‐subcortical‐cerebellar circuitry? Schizophr Bull 24: 203–218. - PubMed
-
- Arfanakis K,Cordes D,Haughton VM,Moritz CH,Quigley MA,Meyerand ME ( 2000): Combining independent component analysis and correlation analysis to probe interregional connectivity in fMRI task activation datasets. Magn Reson Imaging 18: 921–930. - PubMed
-
- Bell AJ,Sejnowski TJ ( 1995): An information maximization approach to blind separation and blind deconvolution. Neural Comput 7: 1129–1159. - PubMed
-
- Birn RM,Diamond JB,Smith MA,Bandettini PA ( 2006): Separating respiratory‐variation‐related fluctuations from neuronal‐activity‐related fluctuations in fMRI. Neuroimage 31: 1536–1548. - PubMed
Publication types
MeSH terms
Grants and funding
LinkOut - more resources
Full Text Sources
Miscellaneous
