. 2008 May;36(5):545-558.
doi: 10.1016/j.exphem.2007.12.012.

Tumor necrosis factor-alpha and endothelial cells modulate Notch signaling in the bone marrow microenvironment during inflammation

Affiliations

Tumor necrosis factor-alpha and endothelial cells modulate Notch signaling in the bone marrow microenvironment during inflammation

Luis Fernandez et al. Exp Hematol. 2008 May.

Abstract

Objective: Homeostasis of the hematopoietic compartment is challenged and maintained during conditions of stress by mechanisms that are poorly defined. To understand how the bone marrow (BM) microenvironment influences hematopoiesis, we explored the role of Notch signaling and BM endothelial cells in providing microenvironmental cues to hematopoietic cells in the presence of inflammatory stimuli.

Materials and methods: The human BM endothelial cell line (BMEC) and primary human BM endothelial cells were analyzed for expression of Notch ligands and the ability to expand hematopoietic progenitors in an in vitro coculture system. In vivo experiments were carried out to identify modulation of Notch signaling in BM endothelial and hematopoietic cells in mice challenged with tumor necrosis factor-alpha (TNF-alpha) or lipopolysaccharide (LPS), or in Tie2-tmTNF-alpha transgenic mice characterized by constitutive TNF-alpha activation.

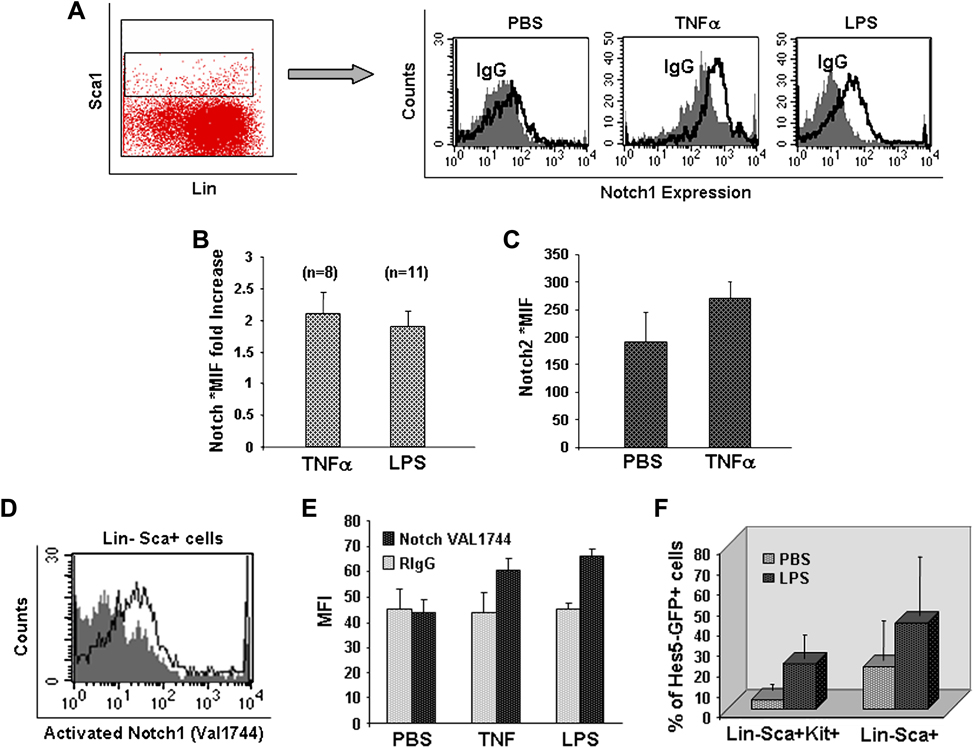
Results: BM endothelial cells were found to express Jagged ligands and to greatly support progenitor's colony-forming ability. This effect was markedly decreased by Notch antagonists and augmented by increasing levels of Jagged2. Physiologic upregulation of Jagged2 expression on BMEC was observed upon TNF-alpha activation. Injection of TNF-alpha or LPS upregulated three- to fourfold Jagged2 expression on murine BM endothelial cells in vivo and resulted in increased Notch activation on murine hematopoietic stem/progenitor cells. Similarly, constitutive activation of endothelial cells in Tie2-tmTNF-alpha mice was characterized by increased expression of Jagged2 and by augmented Notch activation on hematopoietic stem/progenitor cells.

Conclusions: Our results provide the first evidence that BM endothelial cells promote expansion of hematopoietic progenitor cells by a Notch-dependent mechanism and that TNF-alpha and LPS can modulate the levels of Notch ligand expression and Notch activation in the BM microenvironment in vivo.


Figures

Figure 1
Figure 1. J2 is expressed by BM-derived endothelial cells
(A–C) Characterization of human BM derived endothelial cells. BMEC clones (representing two different passages) and primary BM-ECs were harvested and labeled with the indicated antibodies in combination with CD45 and CD105 followed by multicolor analysis. (A) Dot blots show immunoglobulin controls (left) and expression of CD105 and CD45 in one representative sample. (B) CD45CD105+ cells were analyzed for the expression of the indicated markers. Bar graphs represent 1 of 3 independent experiments. Numbers indicate average of mean fluorescence intensity of 3 samples for each antibody. Error bars represent standard deviation. (C) Histogram shows overlays of Neuropilin expression (dark gray filled curve) over IgG control (light gray filled curve) on: BMEC (left panel) and primary BM-ECs (right panel). (D) Notch ligand expression profile in human BM-derived endothelial cells. RNAs obtained from BMEC and BM-EC samples were used for RT-PCR amplification. All samples were positive for the low molecular size PCR product of the housekeeping gene GSα, confirming the absence of genomic DNA [22]. RNAs from MS-5 cells overexpressing human cDNA of each ligand were used as PCR positive control (PC). (E) Left panel: 3T3 cells were transduced with pBABE retrovirus alone or containing human J2 cDNA. Cells were selected by puromycin and J2 expression was confirmed by western blot analysis. 3T3-vector and 3T3-J2 cells were labeled with polyclonal anti-J2 antibodies followed by anti-rabbit PE-conjugated antibody. Histogram shows overlays of J2 expression on 3T3-vector (solid line) and on 3T3-J2 cells (dotted line); gray filled curve shows rabbit IgG control on 3T3-J2 cells. Right panel: Histogram shows overlays of J2 expression (solid line) and of control immunoglobulins (filled curve) on BMEC cells. (F) Flow cytometric analysis of J2 on primary BM-ECs. Histograms show fluorescence intensity on the x-axis and cell count on the y-axis. Superimposed are fluorograms with anti-J2 antibody (solid lines) and control immunoglobulins (filled curves) on BM-EC samples derived from four different donors and on BM stroma derived from a donor.
Figure 2
Figure 2. BM endothelial cells promote expansion of hematopoietic progenitor cells by a Notch dependent mechanism
(A) CD34+ cells were grown in liquid culture on plastic alone in the presence of cytokines (CO) or on BMEC monolayers, in the absence or presence of GSI (2uM). After 5 days, cells were harvested, washed and plated in quadruplicate, at a density of 5,000 cells/ml, in methylcellulose supplemented with IL-3, SCF and EPO. Bar values indicate the average of 3 experiments. CFCs are expressed as number of colonies per 1000 cells seeded. Error bars represent standard error. Differences between the populations (BMEC vs CO; BMEC vs BMEC+GSI) are statistically significant p < 0.02. (B) CD34+ cells cocultured with BMEC-GFP or BMEC-J2 in the presence or absence of GSI (2uM) were harvested at day 5 of co-culture and plated in triplicate at the density of 5000 cells/ml in methylcellulose, as described above. Bars represent the average of 4 experiments. CFCs are expressed as number of colonies per 1000 cells seeded. Error bars represent standard error. Differences between populations (BMEC-J2 vs BMEC-GFP and BMEC-J2+GSI) are statistically significant p < 0.001; (C) RNAs from CD34+ cells cultured alone or in the presence of BMEC and BMEC-J2, in the presence or absence of GSI, were used for RT-PCR amplification of the Hes1 gene. The two blots are representative of two independent experiments. (D–E) CD34+ cells where incubated with Fc fragment (control), Dll4-Fc or anti-N1 antibody for one hour prior to seeding into BMEC monolayers. (D) Expression of activated Notch in CD34+ progenitors. CD34+ cells in the different conditions were harvested after 24 hours of coculture. Cell extracts were analyzed by immunoblot by using a Notch antibody detecting the activated form of Notch. Bar graphs represent ImageQuant densitometric analysis of Notchic protein level. Values indicate percentage of Notchic detected following incubation with N1ab or Dll4-Fc relative to the Fc control (100%). Notch densitometric values were normalized with β-actin levels. (E) CD34+ cells were harvested at 72 hours of co-culture and seeded at 3000/ml in methylcellulose. Bar graphs represent two independent experiments. Bars values are average of 4 wells and represents number of colonies, CFCs, per 1000 cells seeded. Error bars represent standard error.
Figure 3
Figure 3. J2 expression on BM-derived endothelial cells is upregulated by TNFα in vitro
(A) BMEC cell line was stimulated with TNFα (10 ng/ml), and cells harvested and labeled with anti-J2 antibody at the indicated time points. Histograms on the left show flow cytometric analysis of a representative experiment. Superimposed are fluorograms with anti-J2 antibody (solid line) and control immunoglobulin (filled curve). Bar graph on the right represents summary of multiple independent experiments (n=4). Numbers indicate average values of normalized Median Fluorescence Intensity (*MFI) of J2 expression relative to IgG controls (*MFI= MFI J2 - MFI IgG1). * Difference between populations is statistically significant: TNFα at 12 hrs vs 0 hrs p = <0.01. (B) RNAs obtained from BMEC samples stimulated with TNFα (10 ng/ml) were used for RT-PCR amplification of J2 and Gsα. (C) Primary BM-ECs were stimulated with TNFα (10 ng/ml), harvested and labeled with anti-J2 antibody. Histograms show intensity of J2 expression. Superimposed are fluorograms with anti-J2 antibody on cells stimulated with TNFα for 24 hours (solid lines) and 48 hours (dotted lines) and on cells not stimulated (basal expression, solid filled curve). (D) BMEC stimulated by TNFα (10 ng/ml) were harvested at the indicated time points and labeled with anti-CD54 (ICAM-1) monoclonal antibody. Histogram shows intensity of ICAM-1 expression. Superimposed are fluorograms with anti-ICAM-1 on cells stimulated with TNFα for 6 hours (solid thin line), 12 hours (overlap with the 6 hours) and 24 hours (dotted lines), and on cells not stimulated (solid thick line) and immunoglobulins control (solid filled curve). (E) The line graph shows a representative case of three (BM-EC1) stimulated with IL1β (10 ng/ml) or with TNFα (10ng/ml) for 3 days. Values in the graph represent values of normalized J2- *MFI during time.
Figure 4
Figure 4. TNFα and LPS upregulate J2 expression on BM endothelial cells in vivo
(A) Identification of endothelial cell population in the BM. BM cells from TIE2-GFP and not transgenic control mice were labeled with antibody directed to CD45, CD31 and FLK1. Dot blots on the left show expression of CD31 and FLK1 on gated CD45 negative cells (R2). Dot blots on the right show auto-fluorescence in the FL-1 channel and TIE2 promoter-driven GFP on gated CD45CD31+FLK1+ population from a not transgenic mouse and a TIE2-GFP reporter mouse, respectively. CD31/FLK1- cells (R3, bottom dot blot) were used as internal negative control for GFP. (B) Histograms show intensity of J2 expression on BM endothelial cells derived from mice injected with TNFα (10 ug) or LPS (500 ug) at 12 hours from injection compared to PBS. Superimposed are fluorograms with IgG control (IgG, solid filled curve, light gray) and anti-J2 antibody on cells derived from mice control treated with PBS (solid filled curve, dark gray) or stimulated with TNFα for 12 hours (solid line, black). (C) Bar graph represents summary of J2 upregulation by TNFα or LPS over time in multiple independent experiments (n = 4). Numbers indicate average of normalized MFI (*MFI) values for J2 expression on BM endothelial cells. Error bars represent standard deviation. * Difference between populations is statistically significant: TNFα vs PBS p = 0.03; LPS vs PBS p <0.01; (PBS n=10; TNF n=9; LPS n=5). (D) Bar graph represents average values of TNFα (pg/ml) in the serum of control mice or mice injected with LPS, at 12 hours. Serum was collected from 3 animals/group and triplicate samples for each mouse were analyzed by ELISA. Error bars represent standard deviation. * Difference between populations is statistically significant: p = 0.0012.
Figure 5
Figure 5. TNF and LPS modulate N1 expression and activation on BM progenitors in vivo
(A–F) BM cells were harvested from mice inoculated with PBS, TNF (10 ug) or LPS (500 ug) at 12 hours from injection and were labeled with antibodies directed to lineage markers (Lin), Sca1, c-Kit and than with anti-N1 antibody or antiN1Val1744. (A) Histograms show N1 expression on gated Lin−Sca1+ cells, as shown in the dot blot on the left panel. Superimposed are fluorograms with IgG control (solid filled curve) and with anti-N1 antibody (solid line, black) on cells derived from mice inoculated with PBS (controls) or stimulated with either TNFα or LPS. (B) Bar graph represents summary of N1 expression on Lin−Sca1+ cells in multiple independent experiments (n = 4). Values represent average of fold increase of N1 expression (*MFI) in mice that showed upregulation. Number in parenthesis indicates the total number of mice analyzed. Error bars represent standard deviation. To avoid bias due to random variation of fluorescence of intensity, each MFI value for N1 was normalized toward its IgG control (*MFI); in each experiment, the ratio between N1 *MFI in animals challenged with TNFα or LPS and N1 *MFI in mice that received PBS was calculated and expressed as fold difference. (C) Bar graph represents summary of N2 expression on Lin−Sca1+ cells. Values represent average of *MFI in control or TNFα challenged mice (n = 4). Error bars represent standard deviation. (D) Lin−Sca+ gated BM cells were analyzed for expression of activated N1 using the monoclonal antibody against N1ic (Val 1744). Superimposed are fluorograms with N1ic (Val 1744) antibody on cells harvested from TNFα-stimulated (solid line) or control mice (filled curve). (E) Bar graph represents summary of N1ic (Val 1744) expression on Lin−Sca1+ cells in independent experiments (n = 4). For each condition, values represent average of mean intensity of fluorescence of samples labeled with IgG control (gray bars) or with N Val1744 antibody (black bars). (F) Hes5-GFP transgenic mice were injected with PBS or LPS. BM cells were harvested 12 hours after injection, labeled with the indicated antibodies (x-axis) and analyzed by flow cytometry for expression of GFP. Graph shows average percent GFP expression in Lin−Sca1+Kit+ and Lin−Sca1+ subsets. Error bars represent standard deviation.
Figure 6
Figure 6. Jagged2 and Notch signaling are upregulatated in TNFαtm mice bone marrow
BM cells from Tie2-tmTNFα and not transgenic control mice were labeled with antibody combination directed to CD45, CD31 and Flk1, and directed to lineage markers (Lin), Sca1, c-Kit. (A) J2 expression on CD45CD31+Flk1+ BM cells. CD45/CD31/Flk1 staining was followed by intracytoplasmic labeling of J2. Histograms show intensity of J2 expression on gated populations of non-transgenic and Tie2-tmTNFα mice. Superimposed are fluorograms with anti-J2 antibody on CD45CD31+Flk1+ cells (solid filled curve, dark gray) and anti-J2 antibody on CD45CD31+Flk1 cells (solid filled curve, light gray); anti-J2 antibody fluorescence on CD45CD31+Flk1 coincided with IgG controls (not shown). (B) Bar graph represents summary of J2 upregulation in CD45CD31+Flk1+ cells from non transgenic and Tie2-tmTNFα mice (n = 6). Numbers indicate average of normalized MFI (*MFI) values for J2 expression on BM endothelial cells. Error bars represent standard deviation. * Difference between populations is statistically significant: p < 0.01. (C) Notchic expression on LSK cells. Lin/Sca1/c-Kit staining was followed by intracytoplasmic labeling of cleaved Notch using the monoclonal antibody against N1ic. Bar graph represents summary of Notchic upregulation in LinSca+c-Kit+ cells from non transgenic and Tie2-tmTNFα mice (n = 6). Numbers indicate average of normalized MFI (*MFI) values for Notchic expression on LSK cells. Error bars represent standard deviation. * Difference between populations is statistically significant: p = 0.01. (D) Co-localization of J2 and endothelial markers on endothelial cells of BM microvasculature. Images show a microvessel within the BM of a Tie2-tmTNFα mouse. Fixed and decalcified BM sections were stained with rabbit anti-J2 and a mixture of goat anti-VE-cadherin and goat anti-Flk1 antibodies. Donkey anti-rabbit antibody conjugated with Alexa 488 and donkey anti-goat antibody conjugated with Alexa 647 were used as secondary antibody. BM sections were imaged by an Olympus FluoView IX2 confocal microscope. Images show: 40 × magnification of the BM section stained with J2 antibody (green; far left panel); 80 × magnification of BM section with J2 (second panel, green) and VE-Cadherin+ Flk1 staining (red; third panel), merging in an endothelial cell lining in a BM microvessel (yellow; far right panel).

Similar articles

Cited by

References

    1. Suda T, Arai F, Hirao A. Hematopoietic stem cells and their niche. Trends Immunol. 2005;26:426–433. - PubMed
    1. Rafii S, Shapiro F, Pettengell R, et al. Human bone marrow microvascular endothelial cells support long-term proliferation and differentiation of myeloid and megakaryocytic progenitors. Blood. 1995;86:3353–3363. - PubMed
    1. Cines DB, Pollak ES, Buck CA, et al. Endothelial cells in physiology and in the pathophysiology of vascular disorders. Blood. 1998;91:3527–3561. - PubMed
    1. Sieff CA, Tsai S, Faller DV. Interleukin 1 induces cultured human endothelial cell production of granulocyte-macrophage colony-stimulating factor. J Clin Invest. 1987;79:48–51. - PMC - PubMed
    1. Warner SJ, Auger KR, Libby P. Human interleukin 1 induces interleukin 1 gene expression in human vascular smooth muscle cells. J Exp Med. 1987;165:1316–1331. - PMC - PubMed

Publication types

MeSH terms