

Arginases I and II in lungs of ovalbumin-sensitized mice exposed to ovalbumin: sources and consequences
- PMID: 18439639
- PMCID: PMC2578817
- DOI: 10.1016/j.taap.2008.03.004
Arginases I and II in lungs of ovalbumin-sensitized mice exposed to ovalbumin: sources and consequences
Abstract
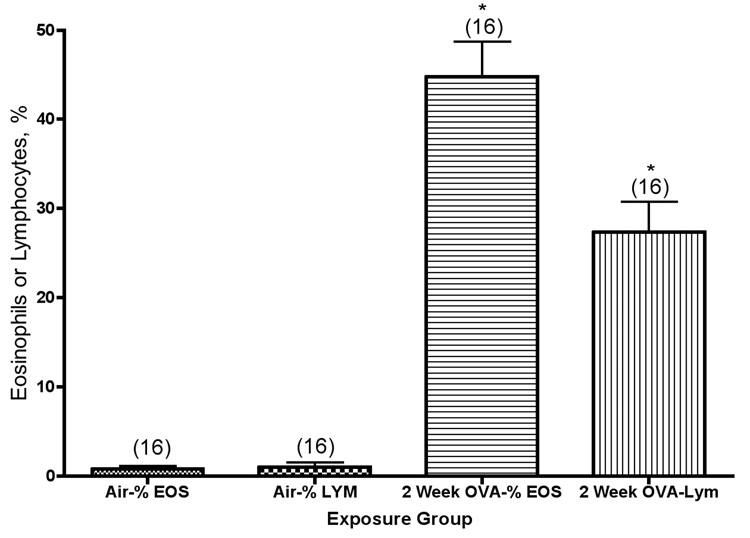
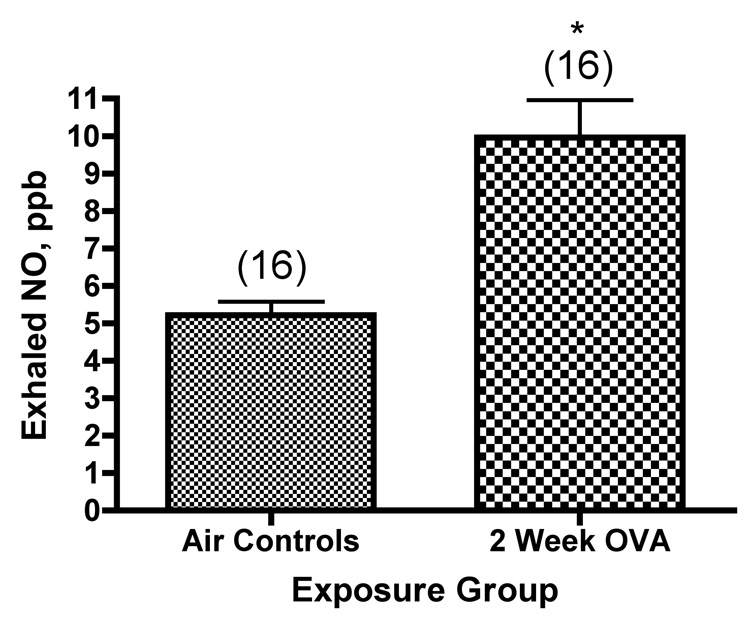
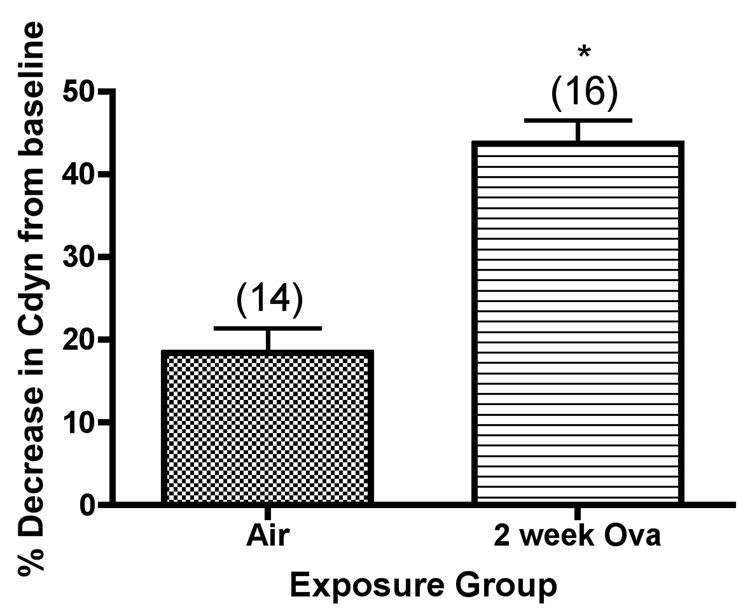
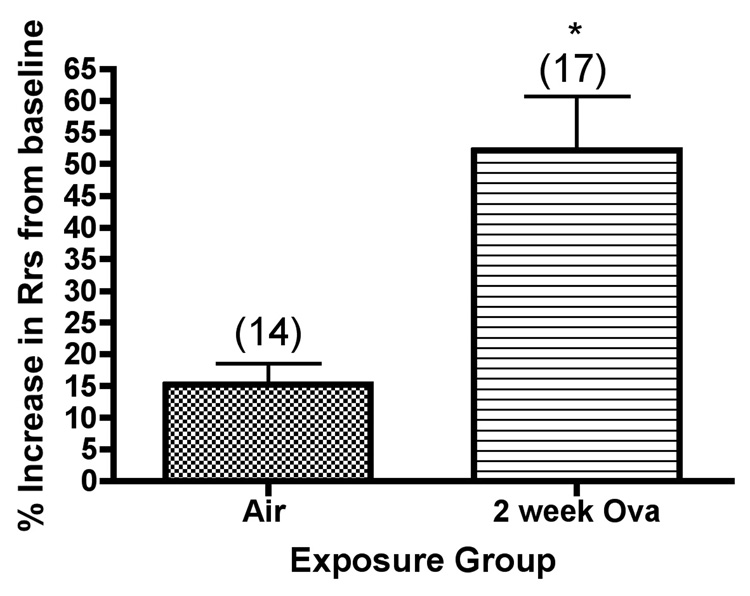
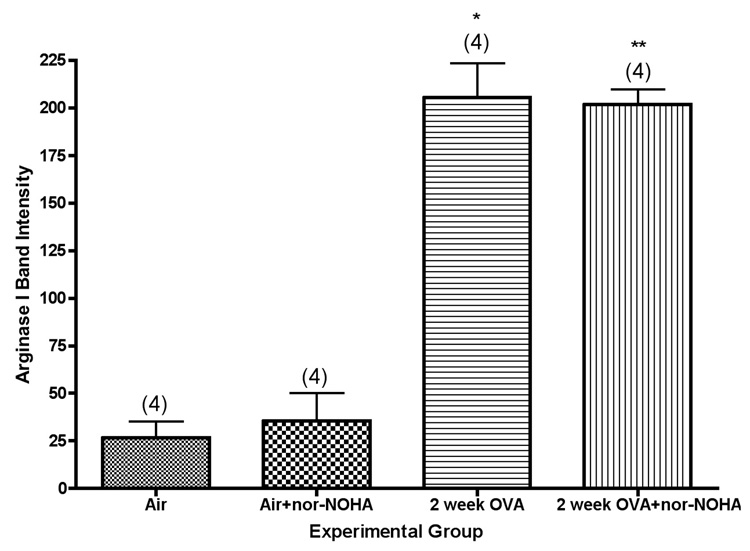
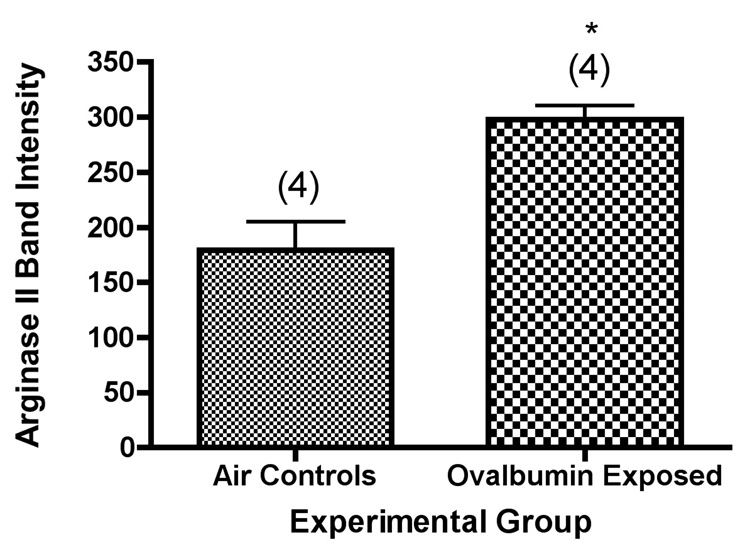
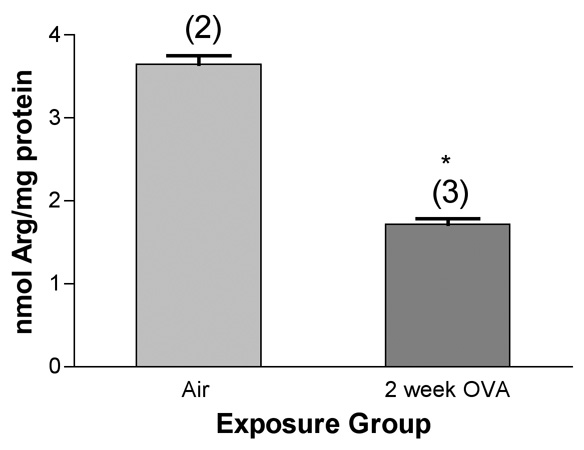
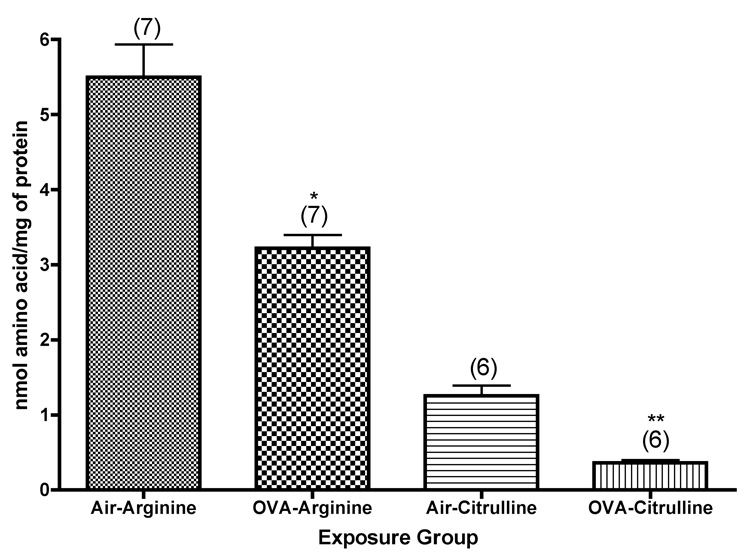
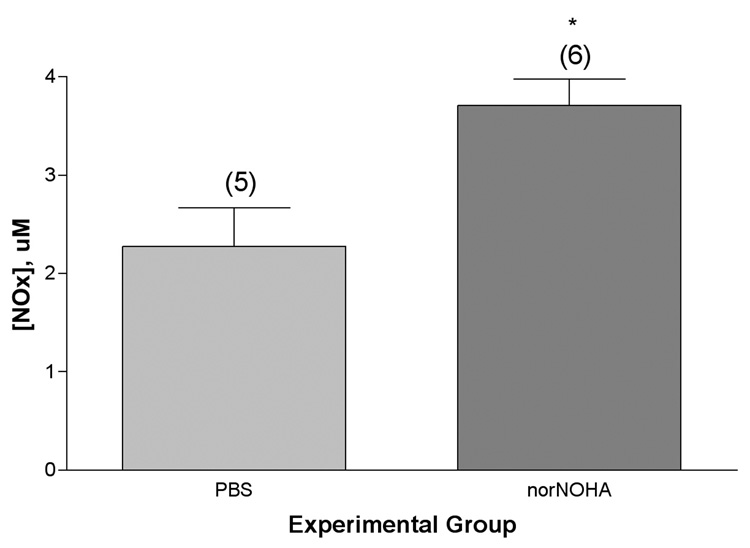
Arginase gene expression in the lung has been linked to asthma both in clinical studies of human patients and in the well-studied mouse model of ovalbumin-induced airway inflammation. Arginase is thought to regulate NO levels in the lung by its ability to divert arginine, the substrate for nitric oxide synthases that produce citrulline and NO, into an alternative metabolic pathway producing ornithine and urea. In the present study arginase I and arginase II concentrations were measured in isolated microdissected airway preparations from sensitized Balb/c mice exposed to ovalbumin aerosol. We found that arginase II was constitutively expressed in the airways of normal mice, whereas arginase I was undetectable in normal airways, while its expression was increased in airways of mice exposed to ovalbumin. The expression of arginase I strongly correlated with the presence of lung inflammation, as quantified by differential cell counts in lung lavage, suggesting that most, or all, of the arginase I in lungs of mice exposed to ovalbumin is present in the inflammatory cells rather than in the airway epithelium. There was also a significant correlation between increased expression of arginase I in the isolated airways and decreased lung compliance. On the other hand, while we found arginase II expression to also be significantly increased in airways from mice exposed to ovalbumin as compared with normal airways, the relative increase was much less than that observed for arginase I, suggesting that there was a smaller contribution of inflammatory cells to the arginase II content of the airways in mice exposed to ovalbumin. There was no apparent correlation between the content of arginase in isolated airways and exhaled NO concentration in the expired air from mice exposed to ovalbumin. However, there was a correlation between exhaled NO concentration from mice exposed to ovalbumin and the lymphocyte content of the lung lavage. The concentration of arginine found in isolated airways from Balb/c mice exposed for 2 weeks to ovalbumin was about half of the value found in isolated microdissected airways from normal mice. Treatment of mice systemically with an arginase inhibitor significantly increased the amount of NO produced, as measured as the amount of nitrite+nitrate (NOx) in lung lavage supernatant prepared from mice exposed to ovalbumin. Our results are consistent with the hypothesis that the response of the lung to ovalbumin challenge includes an adaptive response in the large airways regulating the concentration of arginine within cells of the airway epithelium and subepithelial layer, by shunting of arginine into the metabolic pathway for increased synthesis of NO.
Conflict of interest statement
Conflict of Interest Statement: None of the authors have any conflicts of interest to disclose.
Figures
References
-
- ATS/ERS recommendations for standardized procedures for the online and offline measurement of exhaled lower respiratory nitric oxide and nasal nitric oxide. Am. J. Respir. Crit. Care Med. 2005;171:912–930. - PubMed
-
- Fajardo I, Svensson L, Bucht A, Pejler G. Increased levels of hypoxia-sensitive proteins in allergic airway inflammation. Am. J. Respir. Crit. Care Med. 2004;170:477–484. - PubMed
-
- Jones BN, Gilligan JP. o-phthaldialdehyde precolumn derivatization and reversed-phase high-performance liquid chromatography of polypeptide hydrolysates and physiological fluids. J. Chromatogr. 1983;266:471–482. - PubMed
-
- Kenyon NJ, Gohil K, Last JA. Susceptibility to ovalbumin-induced airway inflammation and fibrosis in inducible nitric oxide synthetase-deficient mice: mechanisms and consequences. Toxicol. Appl. Pharmacol. 2003b;191:2–11. - PubMed
-
- Kenyon NJ, Last JA. Reversible and irreversible airway inflammation and fibrosis in mice exposed to inhaled ovalbumin. Inflammation Res. 2005;54:57–65. - PubMed
Publication types
MeSH terms
Substances
Grants and funding
LinkOut - more resources
Full Text Sources
Research Materials
