

Solution conformation, backbone dynamics and lipid interactions of the intrinsically unstructured malaria surface protein MSP2
- PMID: 18440022
- PMCID: PMC4432223
- DOI: 10.1016/j.jmb.2008.03.039
Solution conformation, backbone dynamics and lipid interactions of the intrinsically unstructured malaria surface protein MSP2
Abstract
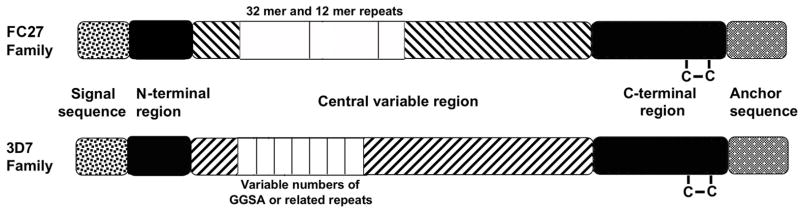
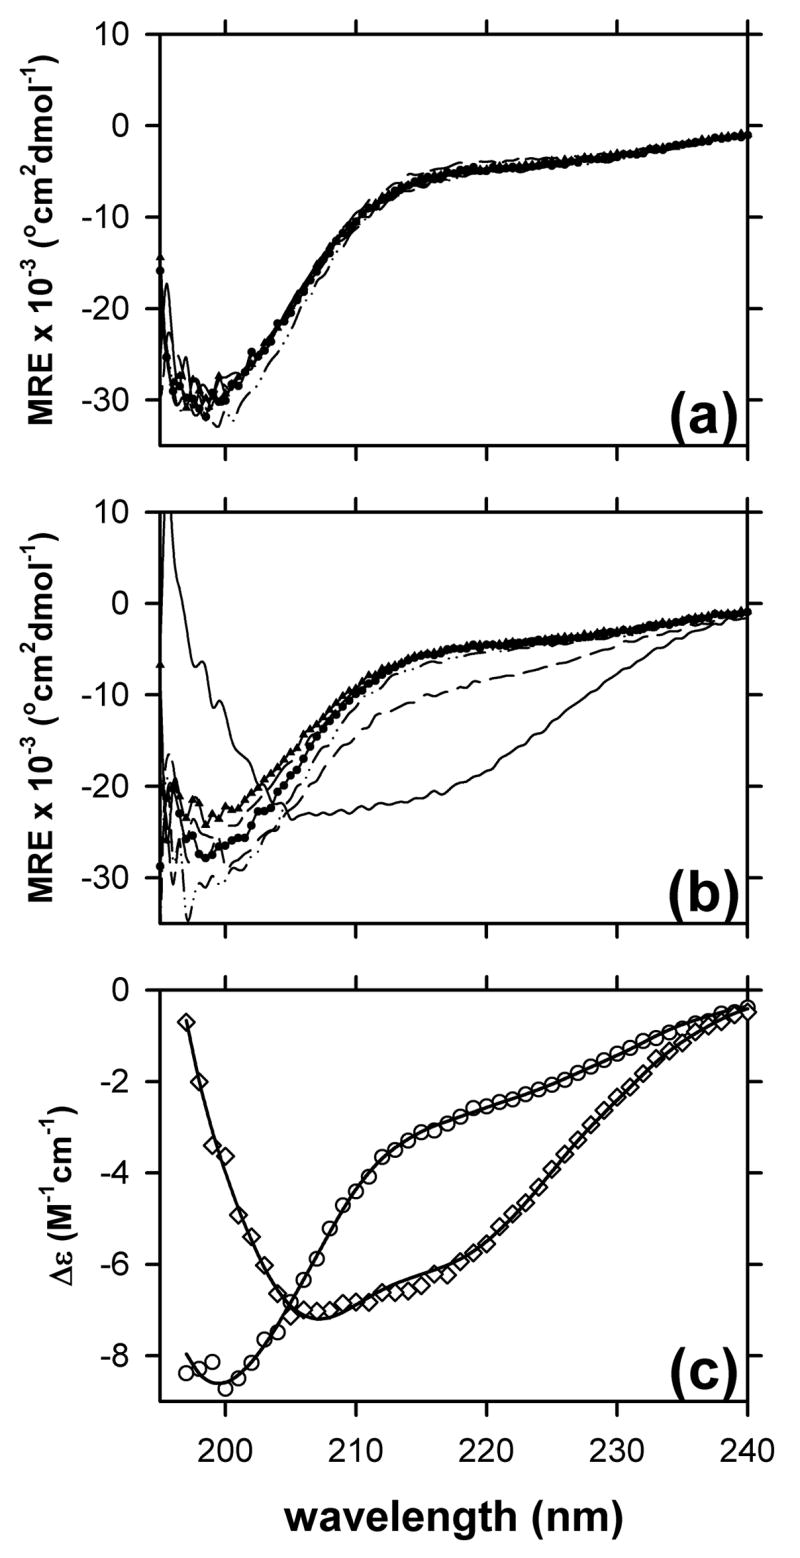
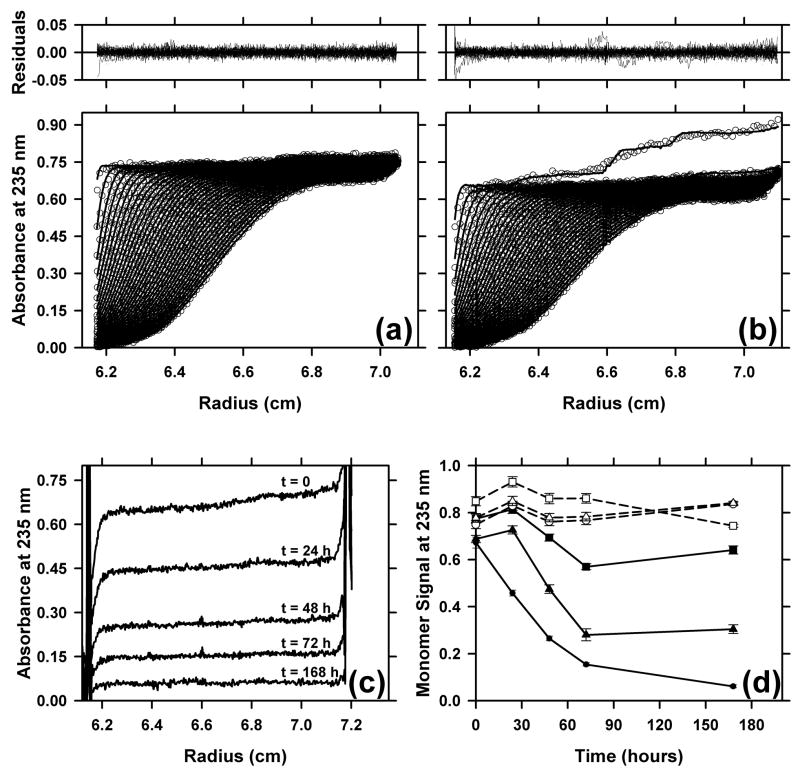
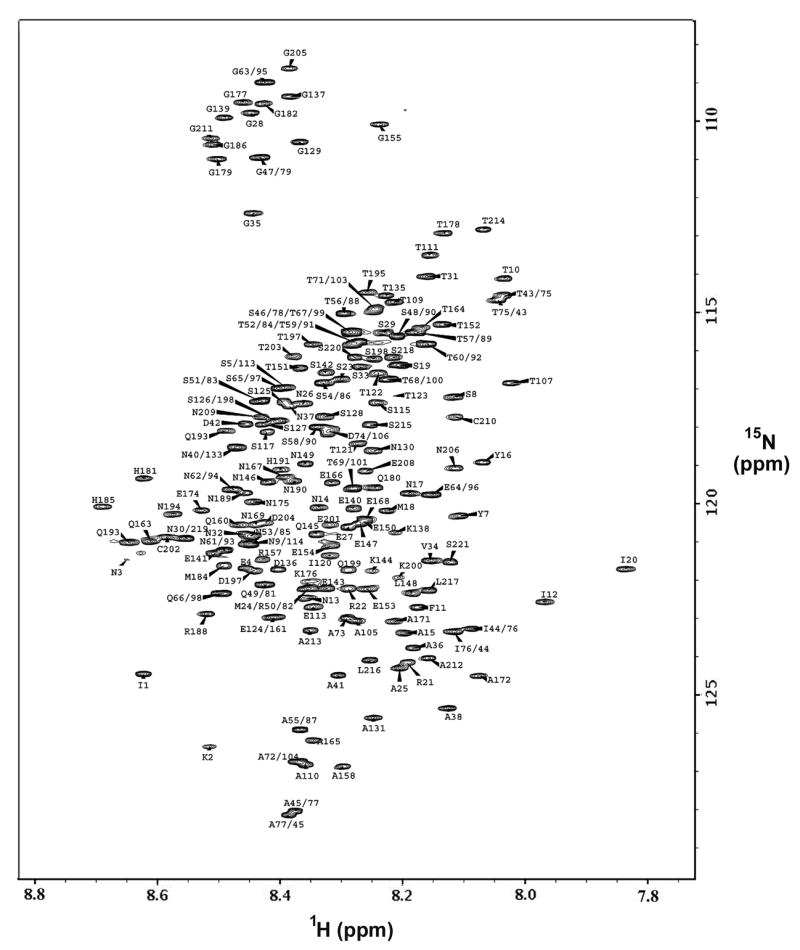
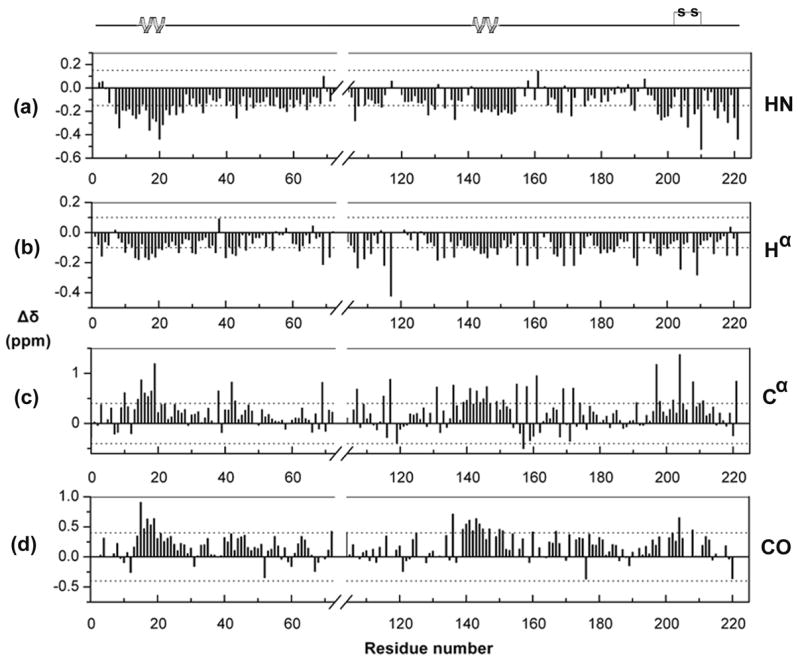
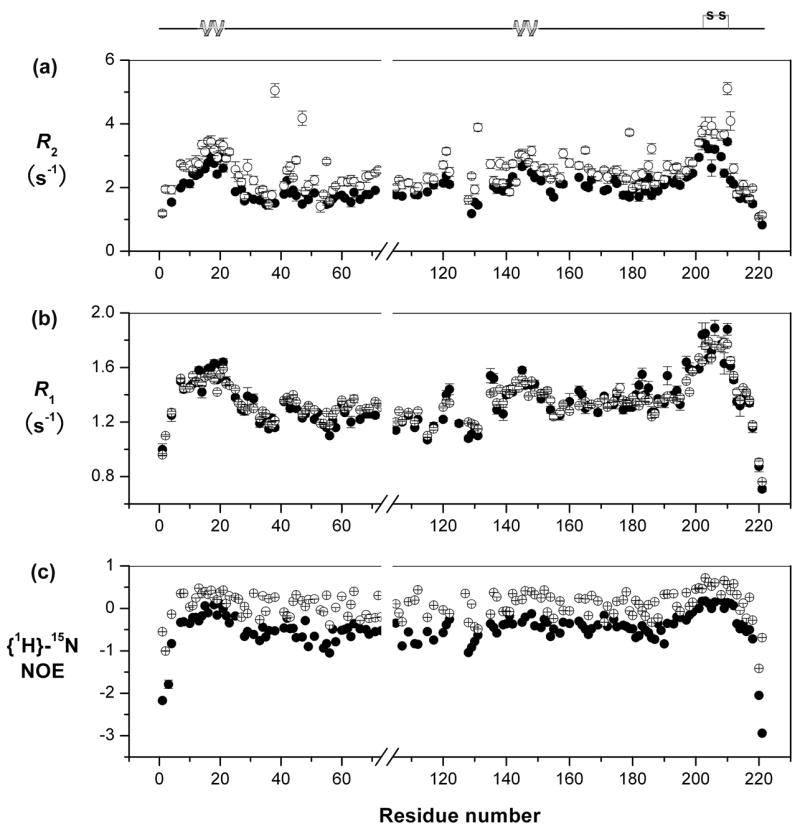
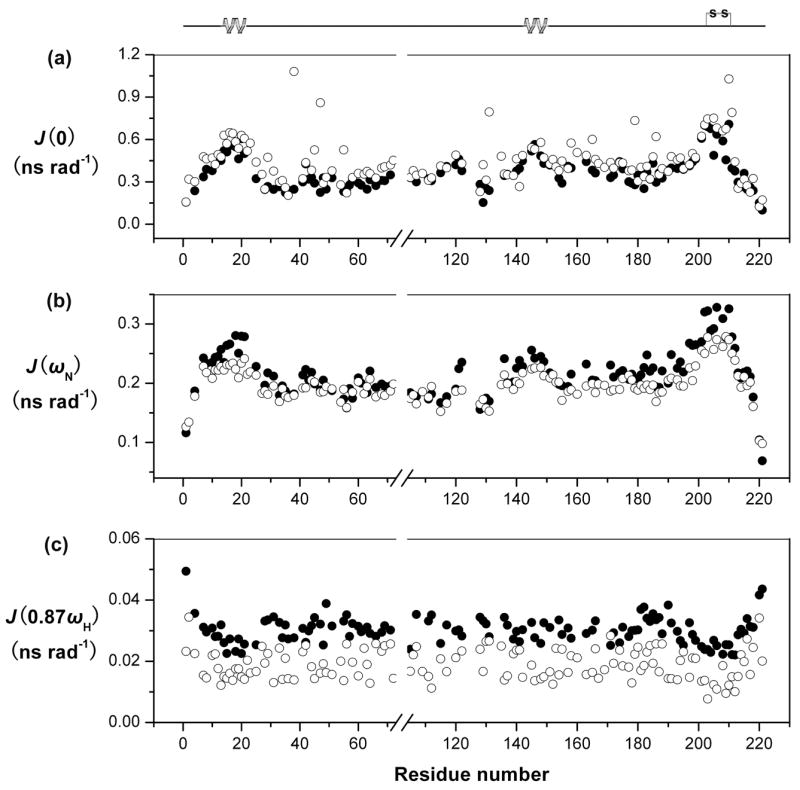
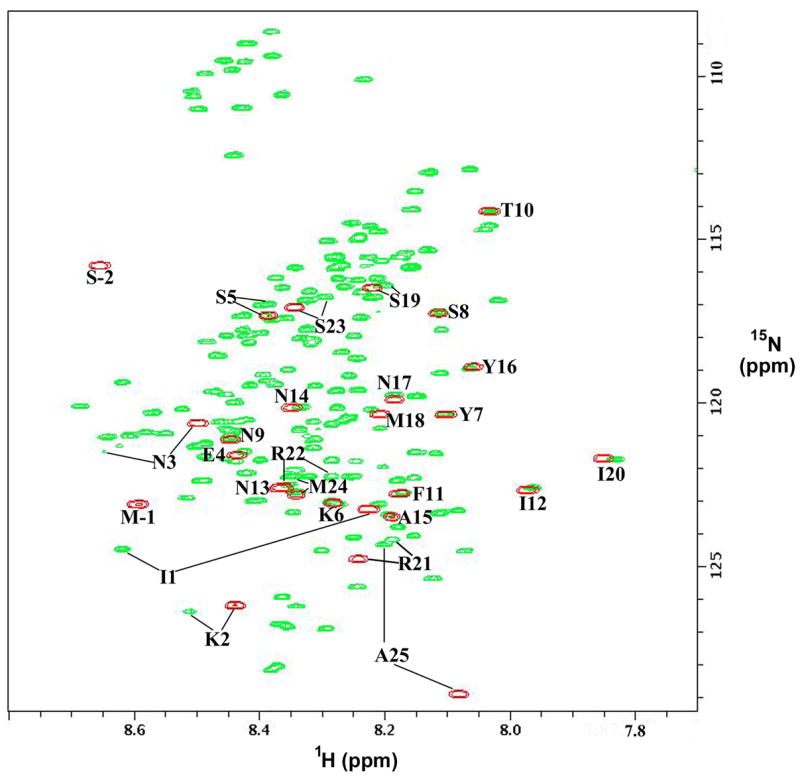
Merozoite surface protein 2 (MSP2), one of the most abundant proteins on the surface of the merozoite stage of Plasmodium falciparum, is a potential component of a malaria vaccine, having shown some efficacy in a clinical trial in Papua New Guinea. MSP2 is a GPI-anchored protein consisting of conserved N- and C-terminal domains and a variable central region. Previous studies have shown that it is an intrinsically unstructured protein with a high propensity for fibril formation, in which the conserved N-terminal domain has a key role. Secondary structure predictions suggest that MSP2 contains long stretches of random coil with very little alpha-helix or beta-strand. Circular dichroism spectroscopy confirms this prediction under physiological conditions (pH 7.4) and in more acidic solutions (pH 6.2 and 3.4). Pulsed field gradient NMR diffusion measurements showed that MSP2 under physiological conditions has a large effective hydrodynamic radius consistent with an intrinsic pre-molten globule state, as defined by Uversky. This was supported by sedimentation velocity studies in the analytical ultracentrifuge. NMR resonance assignments have been obtained for FC27 MSP2, allowing the residual secondary structure and backbone dynamics to be defined. There is some motional restriction in the conserved C-terminal region in the vicinity of an intramolecular disulfide bond. Two other regions show motional restrictions, both of which display helical structure propensities. One of these helical regions is within the conserved N-terminal domain, which adopts essentially the same conformation in full-length MSP2 as in corresponding peptide fragments. We see no evidence of long-range interactions in the full-length protein. MSP2 associates with lipid micelles, but predominantly through the N-terminal region rather than the C terminus, which is GPI-anchored to the membrane in the parasite.
Figures
Similar articles
-
A partially structured region of a largely unstructured protein, Plasmodium falciparum merozoite surface protein 2 (MSP2), forms amyloid-like fibrils.J Pept Sci. 2007 Dec;13(12):839-48. doi: 10.1002/psc.910. J Pept Sci. 2007. PMID: 17883245
-
Lipid interactions of the malaria antigen merozoite surface protein 2.Biochim Biophys Acta. 2012 Nov;1818(11):2572-8. doi: 10.1016/j.bbamem.2012.06.015. Epub 2012 Jun 27. Biochim Biophys Acta. 2012. PMID: 22749949
-
Identification of key residues involved in fibril formation by the conserved N-terminal region of Plasmodium falciparum merozoite surface protein 2 (MSP2).Biochimie. 2010 Oct;92(10):1287-95. doi: 10.1016/j.biochi.2010.06.001. Epub 2010 Jun 11. Biochimie. 2010. PMID: 20542076 Free PMC article.
-
Role of the helical structure of the N-terminal region of Plasmodium falciparum merozoite surface protein 2 in fibril formation and membrane interaction.Biochemistry. 2012 Feb 21;51(7):1380-7. doi: 10.1021/bi201880s. Epub 2012 Feb 8. Biochemistry. 2012. PMID: 22304430
-
Antigenic characterization of an intrinsically unstructured protein, Plasmodium falciparum merozoite surface protein 2.Infect Immun. 2012 Dec;80(12):4177-85. doi: 10.1128/IAI.00665-12. Epub 2012 Sep 10. Infect Immun. 2012. PMID: 22966050 Free PMC article.
Cited by
-
Monomeric α-synuclein binds Congo Red micelles in a disordered manner.Biochemistry. 2012 Jan 17;51(2):631-42. doi: 10.1021/bi201435d. Epub 2012 Jan 4. Biochemistry. 2012. PMID: 22242826 Free PMC article.
-
Structural basis for epitope masking and strain specificity of a conserved epitope in an intrinsically disordered malaria vaccine candidate.Sci Rep. 2015 May 12;5:10103. doi: 10.1038/srep10103. Sci Rep. 2015. PMID: 25965408 Free PMC article.
-
Biophysical characterization of intrinsically disordered proteins.Curr Opin Struct Biol. 2009 Feb;19(1):23-30. doi: 10.1016/j.sbi.2008.12.004. Epub 2009 Jan 21. Curr Opin Struct Biol. 2009. PMID: 19162471 Free PMC article. Review.
-
Evolution in action: N and C termini of subunits in related T = 4 viruses exchange roles as molecular switches.Structure. 2010 Jun 9;18(6):700-9. doi: 10.1016/j.str.2010.03.010. Structure. 2010. PMID: 20541507 Free PMC article.
-
EGCG disaggregates amyloid-like fibrils formed by Plasmodium falciparum merozoite surface protein 2.Arch Biochem Biophys. 2011 Sep 15;513(2):153-7. doi: 10.1016/j.abb.2011.07.008. Epub 2011 Jul 19. Arch Biochem Biophys. 2011. PMID: 21784057 Free PMC article.
References
-
- Greenwood B. Between hope and a hard place. Nature. 2004;430:926–927. - PubMed
-
- Balu B, Adams JH. Functional genomics of Plasmodium falciparum through transposon-mediated mutagenesis. Cell Microbiol. 2006;8:1529–1536. - PubMed
-
- Genton B, Betuela I, Felger I, Al-Yaman F, Anders RF, Saul A, Rare L, Baisor M, Lorry K, Brown GV, Pye D, Irving DO, Smith TA, Beck HP, Alpers MP. A recombinant blood-stage malaria vaccine reduces Plasmodium falciparum density and exerts selective pressure on parasite populations in a phase 1-2b trial in Papua New Guinea. J Infect Dis. 2002;185:820–827. - PubMed
-
- Genton B, Al-Yaman F, Betuela I, Anders RF, Saul A, Baea K, Mellombo M, Taraika J, Brown GV, Pye D, Irving DO, Felger I, Beck HP, Smith TA, Alpers MP. Safety and immunogenicity of a three-component blood-stage malaria vaccine (MSP1, MSP2, RESA) against Plasmodium falciparum in Papua New Guinean children. Vaccine. 2003;22:30–41. - PubMed
Publication types
MeSH terms
Substances
Grants and funding
LinkOut - more resources
Full Text Sources
