. 2008 Jun;162(3):436-50.
doi: 10.1016/j.jsb.2008.02.008. Epub 2008 Mar 21.

Classification and 3D averaging with missing wedge correction in biological electron tomography

Affiliations

Classification and 3D averaging with missing wedge correction in biological electron tomography

A Bartesaghi et al. J Struct Biol. 2008 Jun.

Abstract

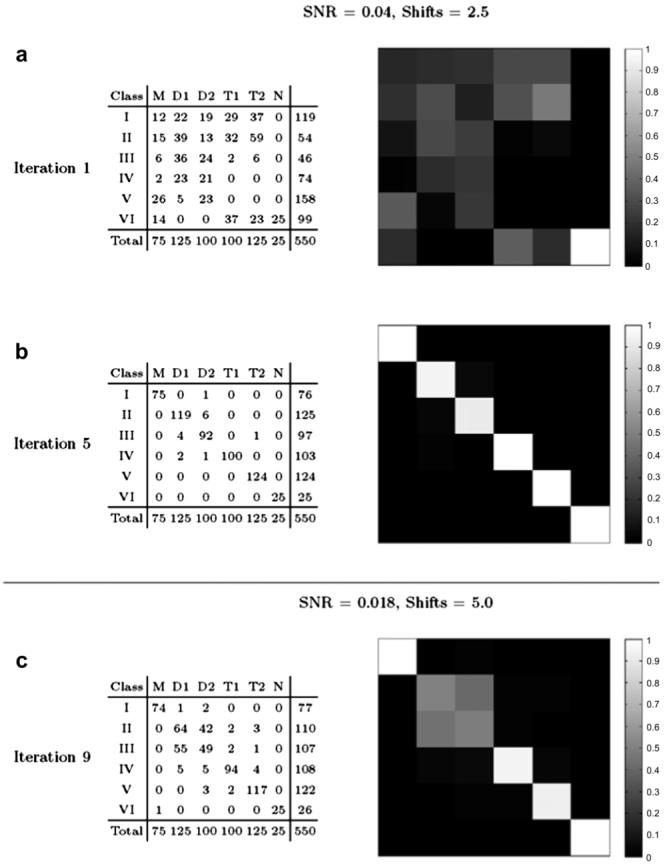
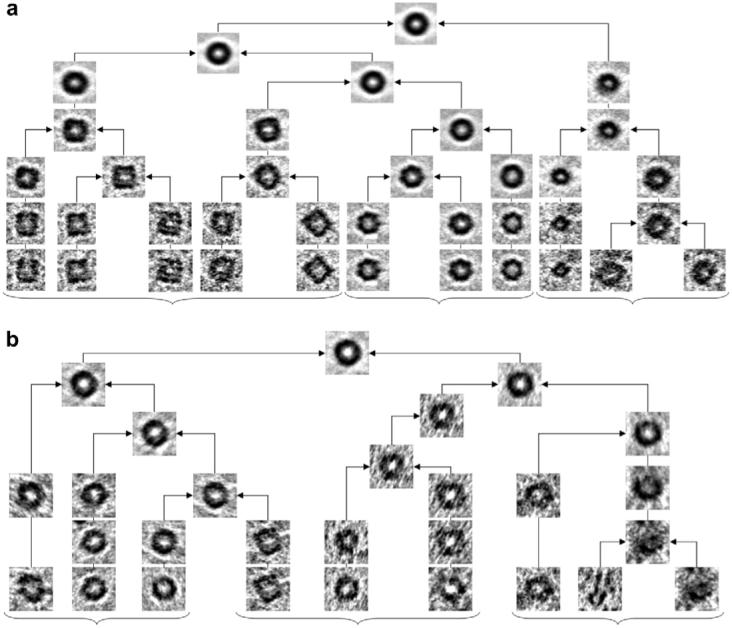
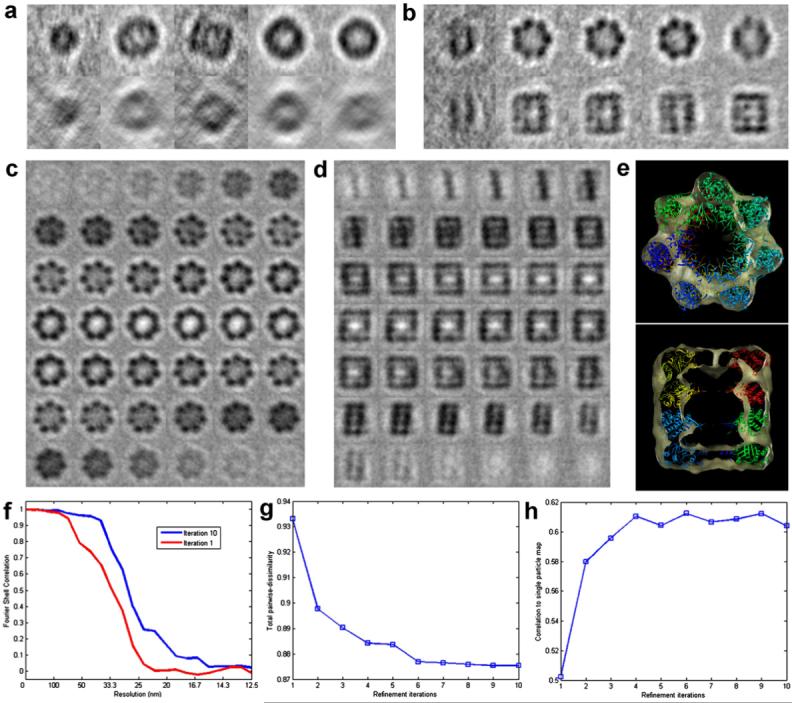
Strategies for the determination of 3D structures of biological macromolecules using electron crystallography and single-particle electron microscopy utilize powerful tools for the averaging of information obtained from 2D projection images of structurally homogeneous specimens. In contrast, electron tomographic approaches have often been used to study the 3D structures of heterogeneous, one-of-a-kind objects such as whole cells where image-averaging strategies are not applicable. Complex entities such as cells and viruses, nevertheless, contain multiple copies of numerous macromolecules that can individually be subjected to 3D averaging. Here we present a complete framework for alignment, classification, and averaging of volumes derived by electron tomography that is computationally efficient and effectively accounts for the missing wedge that is inherent to limited-angle electron tomography. Modeling the missing data as a multiplying mask in reciprocal space we show that the effect of the missing wedge can be accounted for seamlessly in all alignment and classification operations. We solve the alignment problem using the convolution theorem in harmonic analysis, thus eliminating the need for approaches that require exhaustive angular search, and adopt an iterative approach to alignment and classification that does not require the use of external references. We demonstrate that our method can be successfully applied for 3D classification and averaging of phantom volumes as well as experimentally obtained tomograms of GroEL where the outcomes of the analysis can be quantitatively compared against the expected results.


Figures

Fig. 1
Fig. 1
Missing wedge in limited-angle tomography. (a) Projections taken in a limited angular range provide information only in a region of Fourier space (blue) leaving a wedge-shaped region where no measurements are available (red). (b) Spherical representation of a volume affected by the missing wedge obtained by projecting the magnitude of the 3D Fourier Transform onto the unit sphere showing the separation between available and missing data.
Fig. 2
Fig. 2
Measuring dissimilarity between partially occluded one-dimensional signals. (a) Missing data represented as product of signal v1 with occluding mask m1. (b) A second signal v2 affected by a different mask m2. (c) Computation of dissimilarity between both signals should be restricted to areas where both masks are non-zero.
Fig. 3
Fig. 3
Average alignment error for different sizes of missing wedge and noise level added to projections. (a) Using cross-correlation alignment without accounting for the missing wedge. Total mean square error = 3.72. (b) Using the technique introduced in Section 4. Total mean square error = 1.37.
Fig. 4
Fig. 4
Effect of alignment errors due to the missing wedge in volume averaging. (a) Starting phantom model. (b) Average of 70 volumes derived without consideration of the missing wedge results in spreading of the unique feature to all three arms due to frequent alignment errors. (c) Average of 70 volumes obtained using our procedure for alignment that accounts for the missing wedge; the feature is correctly recovered in only one of the arms.
Fig. 5
Fig. 5
Phantom models used for validation of our classification strategy (X, Y, Z views). Configurations were designed to be similar to each other to explore performance of the classification routine in separating distinct conformations for a range of related structures.
Fig. 6
Fig. 6
Reconstructions for the T1 phantom configuration using two different levels of noise. (a) Sequential slices of original T1 phantom. (b) Sequential slices of bandpass filtered reconstruction generated with noise added to 40 projections in ±60° range with SNR = 0.04 and random shifts of ±2.5 pixels. (c) Sequential slices of bandpass filtered reconstruction from 40 projections in ±60° range with SNR = 0.018 and ±5 pixel shifts.
Fig. 7
Fig. 7
Classification results as confusion matrices on the phantom experiment for two experimental conditions. (a) Classification results after the first iteration of the algorithm for SNR = 0.04 and tilt alignment errors of ±2.5 pixels. (b) Result after five iterations shows successful separation of the five phantom configurations M, D1, D2, T1 and T2. (c) Classification results after nine iterations for SNR = 0.018 and alignment shifts of ±5 pixels. Most configurations can still be correctly separated, except D1 and D2 which become indistinguishable from one another due to the very high noise level.
Fig. 8
Fig. 8
Slices of raw tomogram of GroEL. (a) 8.2 nm thick overview slice obtained by re-projection of 20 consecutive slices of the original reconstruction. (b) 4.1 Å thick slices (no re-projection) of individual particles extracted for analysis.
Fig. 9
Fig. 9
Simplified hierarchical classification tree for the 345-particle GroEL dataset showing successful clustering of volumes affected by the missing wedge. Each node of the tree corresponds to a three-dimensional volume (that we represent by its central slice) obtained by averaging the child nodes. (a) All volumes have a missing wedge with the same orientation (perpendicular to the page) but with different extents since they were extracted from tomograms with differing tilt ranges. We only show a handful of representative transitions extracted from the full hierarchical tree. At the lowest level shown, partial averages clearly show visually homogeneous clusters corresponding to side views (group to the left), top views (middle group), and intermediate or damaged/incomplete particles (group to the right). Branches merge up gradually, grouping most similar volumes first until all 345 particles become one class (top node). (b) Classification results after volumes have been randomly rotated to shuffle the orientation of the missing wedges. Top and side views are still successfully separated but now appear interchanged: top views is the group to the left, and side views is the group in the middle. Note that the middle group contains averages of side-view particles but now viewed from the top (rightmost sub-group within the middle group). The group to the right again shows and heterogeneous mix likely corresponding to damaged or incomplete particles.
Fig. 10
Fig. 10
Iterative classification and alignment refinement results for GroEL. (a and b) Projection views in two orthogonal directions of five initial class averages (a) and after 10 rounds of refinement (b). (c and d) Consecutive sections of the 3D map obtained after 10 rounds of refinement showing typical low-resolution features of GroEL and clear evidence of the sevenfold symmetry. No symmetry was applied at any stage of image processing. (e) Docking of X-ray coordinates into GroEL map obtained after ten refinement iterations. Quantitative performance plots of the refinement procedure showing the improvement with iterations for three numerical indicators: (f) Fourier Shell Correlation plots, (g) Frobenius norm of all-versus-all dissimilarity matrix, (h) and cross-correlation coefficient of the averaged map to a map of GroEL at 20 Å, obtained by filtering the 6 Å reconstruction reported by Ludtke et al. (2004).

References

    1. Bartesaghi A, Sprechmann P, Randall G, Sapiro G, Subramaniam S. Classification and averaging of electron tomography volumes; 4th IEEE International Symposium on Biomedical Imaging: From Nano to Macro; Washington, DC, USA. 2007.pp. 244–247.
    1. Crowther RA. In: The Molecular Replacement Method. Rossmann MG, editor. Gordon & Breach; New York: 1972. pp. 173–178.
    1. Förster F, Medalia O, Zauberman N, Baumeister W, Fass D. Retrovirus envelope protein complex structure in situ studied by cryo-electron tomography. Proceedings of the National Academy of Sciences of the United States of America. 2005;102(13):4729–4734. - PMC - PubMed
    1. Förster F, Pruggnaller S, Seybert A, Frangakis AS. Classification of cryo-electron sub-tomograms using constrained correlation. Journal of Structural Biology. 2008;161(3):276–286. - PubMed
    1. Frangakis AS, Bohm J, Forster F, Nickell S, Nicastro D, Typke D, Hegerl R, Baumeister W. Identification of macromolecular complexes in cryoelectron tomograms of phantom cells. Proceedings of the National Academy of Sciences. 2002;99(22):14153–14158. - PMC - PubMed

Publication types