. 2008 Jul 1;41(3):1011-20.
doi: 10.1016/j.neuroimage.2008.03.015. Epub 2008 Mar 20.

Touch, sound and vision in human superior temporal sulcus

Affiliations

Touch, sound and vision in human superior temporal sulcus

Michael S Beauchamp et al. Neuroimage. .

Abstract

Human superior temporal sulcus (STS) is thought to be a key brain area for multisensory integration. Many neuroimaging studies have reported integration of auditory and visual information in STS but less is known about the role of STS in integrating other sensory modalities. In macaque STS, the superior temporal polysensory area (STP) responds to somatosensory, auditory and visual stimulation. To determine if human STS contains a similar area, we measured brain responses to somatosensory, auditory and visual stimuli using blood-oxygen level dependent functional magnetic resonance imaging (BOLD fMRI). An area in human posterior STS, STSms (multisensory), responded to stimulation in all three modalities. STSms responded during both active and passive presentation of unisensory somatosensory stimuli and showed larger responses for more intense vs. less intense tactile stimuli, hand vs. foot, and contralateral vs. ipsilateral tactile stimulation. STSms showed responses of similar magnitude for unisensory tactile and auditory stimulation, with an enhanced response to simultaneous auditory-tactile stimulation. We conclude that STSms is important for integrating information from the somatosensory as well as the auditory and visual modalities, and could be the human homolog of macaque STP.


Figures
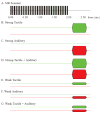
Figure 1
Figure 1. Structure of stimulation trials in experiment 1
A. Sequence of image acquisition and stimulation in experiment 1. Clustered MRI acquisition protocol. During the first 2 sec of each 2.75 sec trial, 33 images were acquired. Each image acquisition (indicated with thick vertical bars) produced sound and vibration from the scanner. Experimental stimuli were presented in the final 0.75 sec of the trial, when no MR image acquisition occurred. B. Sensory stimulus during strong tactile trials. Green line indicates tactile stimulation, red line indicates auditory stimulation. Thick green portion indicates duration of a 200 Hz sinusoidal vibrotactile stimulus applied to the left hand. Gradual rise and fall of the thick green portion reflects the 4 Hz sinusoidal envelope applied to the driving waveform. C. Sensory stimulus during strong auditory trials. Thick red line indicates duration of a 200 Hz sinusoid played in the left ear. D. Sensory stimulus during strong tactile + auditory trials. Thick lines indicate simultaneous tactile + auditory stimulus presentation. E. Unisensory tactile stimulus presented at low intensity. F. Unisensory auditory stimulus presented at low intensity. G. Multisensory tactile + auditory stimulus presented at low intensity.
Figure 2
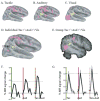
Figure 2. Responses to tactile, auditory and visual stimulation in experiment 1
A. Lateral view of a single subject’s partially inflated right hemisphere. Colored regions responded significantly to tactile stimulation. Active regions in posterior STS are colored yellow, other active regions are colored purple. The fundus of the STS is shown as a white dashed line. B. Single subject activation to auditory stimulation. C. Single subject activation to visual stimulation. D. Single subject conjunction map showing voxels responding to all three modalities. Circled yellow cluster shows the STS multisensory area, STSms. E. Mixed-effects group map (n = 12). Voxels showing a significant response to all three modalities. Yellow cluster shows the STSms, with center of mass (52, 44, 15). F. Single-subject MR time series from STSms. The dark black line shows the deconvolved event related response in a 16.5 second window following stimulation onset for three kinds of trials, collapsed across intensity of stimulation: Tac, tactile stimulation; Aud, auditory stimulation; Tac+Aud, tactile and auditory stimulation. The dashed line shows the mean unisensory response. The colored bars show the 500 ms stimulus duration. G. Group average MR time series from STSms (n = 12). The dark black line shows the mean deconvolved event related response, the gray line shows ± 1 SEM.
Figure 3
Figure 3. Brain areas responding to auditory, visual and tactile stimulation in experiment 2
A. Lateral view of a single subject’s partially inflated right hemisphere. Colored regions responded significantly to tactile stimulation. Active regions in posterior STS are colored yellow, other active regions are colored purple. The fundus of the STS is shown as a white dashed line. B. Single subject activation to auditory stimulation. C. Single subject activation to visual stimulation. D. Single subject conjunction map showing voxels responding to all three modalities. Circled yellow cluster shows the STS multisensory area, STSms. E. Mixed-effects group map (n = 8). Voxels showing a significant response to all three modalities. Yellow cluster shows the STSms, with center of mass (−44, 35, 13) in left hemisphere and (56, 41, 14) in right hemisphere.
Figure 4
Figure 4. Timecourse of average evoked BOLD response (n = 8 subjects) in the STS multisensory area
A. Response to contralateral hand (CH), ipsilateral hand (IH), contralateral foot (CF), and ipsilateral foot (IF) stimulation. Colored bars illustrate 2 second stimulus duration. Black lines show mean, gray lines show ± 1 SEM. B. Response to low-contrast moving points in the contralateral (CVF) and ipsilateral (IVF) visual field. Response to auditory stimuli (AUD) is shown for comparison. Colored bars illustrate 20 second stimulus duration (followed by fixation baseline). C. Response to real (REAL) and scrambled (SCR) photographs.
Figure 5
Figure 5. Relationship between the STS multisensory area (STSms) and areas MT and MST
A. Lateral view of a single subject’s partially inflated left hemisphere. Colored regions responded significantly to all three modalities. Active regions in posterior STS are colored yellow, other active regions are colored purple. The fundus of the STS is shown as a white dashed line. Red box indicates the region enlarged in B. B. Composite map showing multisensory activation and localizer defined MT and MST. White outline shows STSms, blue outline shows MST, green outline shows MT. C. Composite map in an additional hemisphere from a different subject. D. Relationship between macaque area STP and macaque areas MT and MST. The top panel shows a lateral view of a macaque brain (Dickson et al., 2001). The fundus of the STS is shown as a white dashed line. The bottom panel shows an inflated view of the brain, with labeled areas from (Lewis and Van Essen, 2000b): MT, MST (MSTdp+MSTm) and STP (TPOi+TPOc).

References

    1. Adolphs R. Cognitive neuroscience of human social behaviour. Nat Rev Neurosci. 2003;4:165–178. - PubMed
    1. Allison T, Puce A, McCarthy G. Social perception from visual cues: role of the STS region. Trends Cogn Sci. 2000;4:267–278. - PubMed
    1. Allman BL, Meredith MA. Multisensory processing in “unimodal” neurons: cross-modal subthreshold auditory effects in cat extrastriate visual cortex. Journal of Neurophysiology. 2007;98:545–549. - PubMed
    1. Argall BD, Saad ZS, Beauchamp MS. Simplified intersubject averaging on the cortical surface using SUMA. Hum Brain Mapp. 2006;27:14–27. - PMC - PubMed
    1. Aristotle, 350 B.C.E. On Sense and the Sensible. The Internet Classics Archive, translated by J. I. Beare.

Publication types

LinkOut - more resources