. 2008 Apr 25;320(5875):524-7.
doi: 10.1126/science.1155085.

Plastin 3 is a protective modifier of autosomal recessive spinal muscular atrophy

Affiliations

Plastin 3 is a protective modifier of autosomal recessive spinal muscular atrophy

Gabriela E Oprea et al. Science. .

Erratum in

Abstract

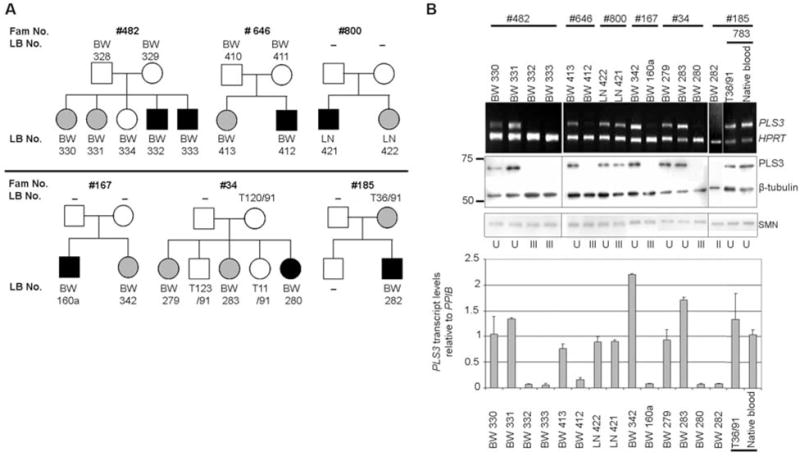
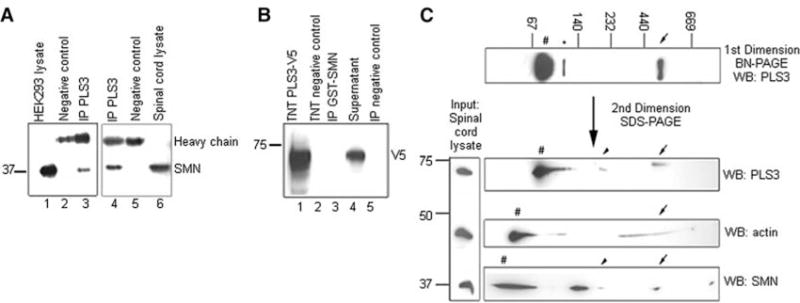
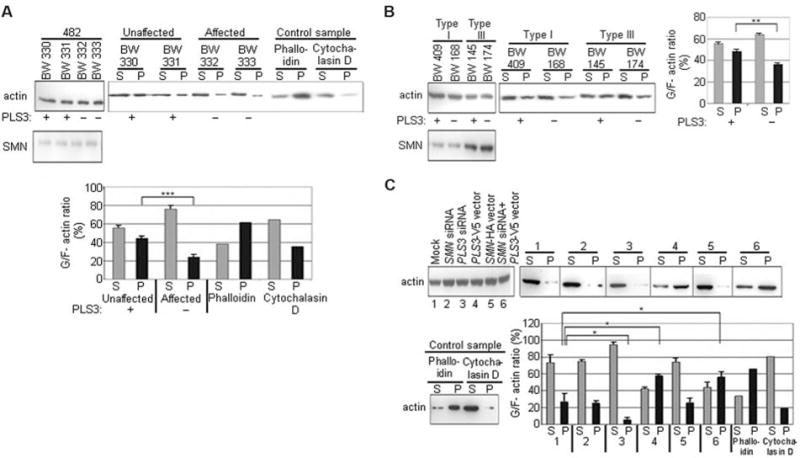
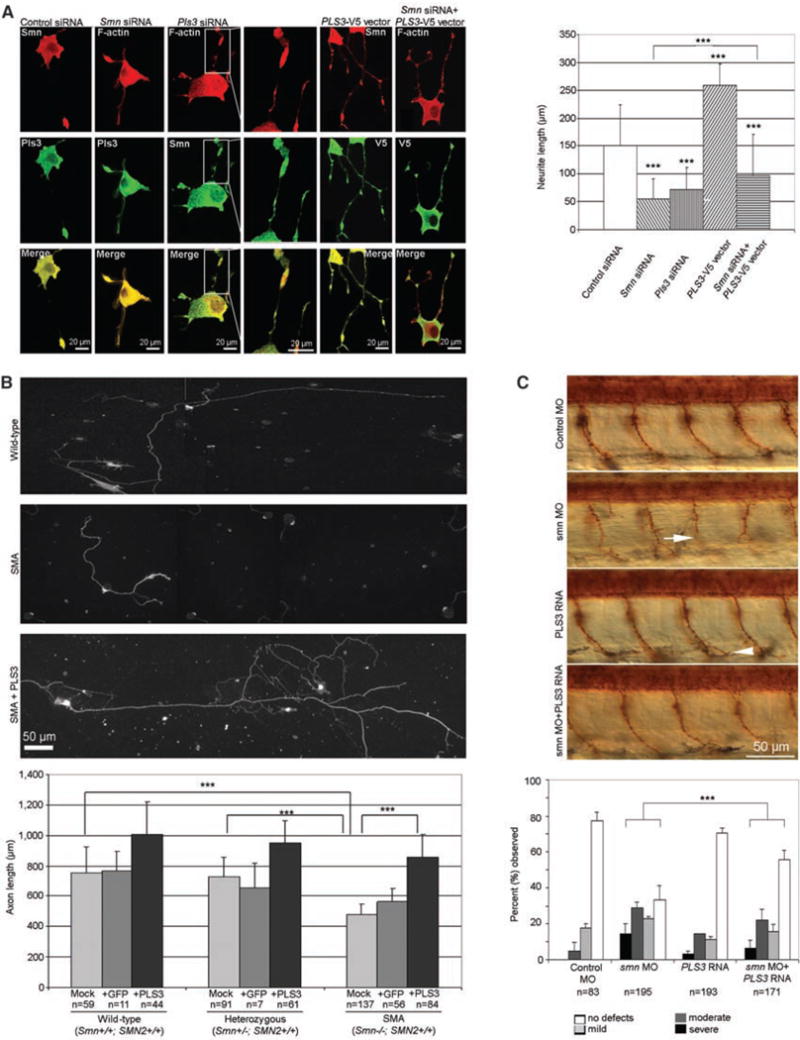
Homozygous deletion of the survival motor neuron 1 gene (SMN1) causes spinal muscular atrophy (SMA), the most frequent genetic cause of early childhood lethality. In rare instances, however, individuals are asymptomatic despite carrying the same SMN1 mutations as their affected siblings, thereby suggesting the influence of modifier genes. We discovered that unaffected SMN1-deleted females exhibit significantly higher expression of plastin 3 (PLS3) than their SMA-affected counterparts. We demonstrated that PLS3 is important for axonogenesis through increasing the F-actin level. Overexpression of PLS3 rescued the axon length and outgrowth defects associated with SMN down-regulation in motor neurons of SMA mouse embryos and in zebrafish. Our study suggests that defects in axonogenesis are the major cause of SMA, thereby opening new therapeutic options for SMA and similar neuromuscular diseases.


Figures

Fig. 1
Fig. 1
Analysis of PLS3 expression in SMA-discordant families. (A) Pedigrees of SMA-discordant families showing unaffected (gray) and affected (black) SMN1-deleted siblings. BW, LN, and T are internal lab codes. –, not available. (B) (Top) sqRT-PCR of PLS3 and HPRT (control) in SMA-discordant families. (Middle) Western blot analysis of PLS3 protein, SMN, and β-tubulin (control). (Bottom) qRT-PCR of PLS3 transcript relative to cyclophilin B (PPIB). Data are mean ± SEM (error bars). U, unaffected; II, type II SMA; III, type III SMA. Equal PLS3 expression was observed in both native blood and LBs (exemplified by individual 783).
Fig. 2
Fig. 2
PLS3 and SMN associate in a large protein complex. (A) HEK293 total cell lysates (lane 1 at left) and murine spinal cord (lane 6 at right) were immunoprecipitated (IP) with anti-PLS3 antibody (lanes 3 and 4) and Western blotted with anti-SMN antibody. (B) Recombinant PLS3-V5 protein produced in vitro using TnT Quick Coupled Transcription/Translation System (Promega) system (lane 1) was incubated with glutathione S-transferase (GST)–SMN, immunoprecipitated with anti-GST beads (lane 3), and analyzed by Western blotting with anti-V5 antibody. (C) Total murine spinal cord lysates were resolved onto BN-PAGE gels and stained with anti-PLS3 antibody. The first-dimension gel was followed by a second SDS-PAGE and Western blot (WB) analysis, allowing the identification of proteins belonging to common protein complexes. Arrows denote the ~500-kilodalton Pls3-Smn-actin complex, and arrowheads denote the ~200-kilodalton Pls3-Smn complex. Number signs indicate monomeric form, and the asterisk indicates putative Pls3 dimer.
Fig. 3
Fig. 3
PLS3 influences the G/F-actin ratio in vivo. G/F-actin levels in (A) SMA-discordant family no. 482, (B) SMA patients, and (C) HEK293 cells after overexpression or knockdown of PLS3 and/or SMN as indicated. (A) to (C) (Left) actin input. (Right) Western blot analysis of G-actin fractions in the supernatant (S) and F-actin fractions in the pellet (P). A phalloidin-treated sample served as a positive control for F-actin; a cytochalasin D–treated sample served as a negative control. +, PLS3 expression; −, no expression. The bar charts show the quantification of G/F-actin levels. Data are mean ± SD (error bars). *P < 0.05; **P < 0.01; ***P < 0.001.
Fig. 4
Fig. 4
PLS3 is involved in axonogenesis and rescues the axon length in SMA MNs. (A) (Left) Confocal microscopy of neuronal differentiated PC12 cells after transfection as indicated above the panel (see fig. S10 for efficiency). The antibodies that were used are indicated. (Right) Measurements of maximum neurite length in PC12 cells (n = 100 neurites) after transfection and nerve growth factor differentiation for three days. (B) (Top) Primary MNs isolated at day E13.5 from WT (Smn+/+; SMN2+/+), heterozygous (Smn+/−; SMN2+/+), and SMA (Smn−/−; SMN2+/+) embryos, cultured for 7 days and immunostained with anti-Tau. (Bottom) The bar chart shows the measurement of axon length from WT, heterozygous, and SMA mouse embryos, which were mock-, GFP-, or PLS3-transduced. (C) (Top) Lateral view of zebrafish embryos treated with control MO, smn MO, PLS3 RNA, and smn MO + PLS3 RNA. Motor axons were visualized with znp1 antibody at 36 hours post fertilization. The arrow indicates a severely truncated motor axon in an smn morphant, and the arrowhead indicates a mild ventral branch in a PLS3 injected embryo. The bar chart illustrates that embryos were classified as severe, moderate, mild, or no defects, as previously described (24), and the percentage for each group is shown. (A) to (C) Data are mean ± SD (error bars). ***P < 10−4.

References

    1. Lefebvre S, et al. Cell. 1995;80:155. - PubMed
    1. Lorson CL, Hahnen E, Androphy EJ, Wirth B. Proc Natl Acad Sci USA. 1999;96:6307. - PMC - PubMed
    1. Lefebvre S, et al. Nat Genet. 1997;16:265. - PubMed
    1. Feldkotter M, Schwarzer V, Wirth R, Wienker TF, Wirth B. Am J Hum Genet. 2002;70:358. - PMC - PubMed
    1. Hahnen E, et al. Hum Mol Genet. 1995;4:1927. - PubMed

Publication types

MeSH terms