. 2008 Jun;36(10):3341-53.
doi: 10.1093/nar/gkn208. Epub 2008 Apr 25.

Direct inhibition of the DNA-binding activity of POU transcription factors Pit-1 and Brn-3 by selective binding of a phenyl-furan-benzimidazole dication

Affiliations

Direct inhibition of the DNA-binding activity of POU transcription factors Pit-1 and Brn-3 by selective binding of a phenyl-furan-benzimidazole dication

Paul Peixoto et al. Nucleic Acids Res. 2008 Jun.

Abstract

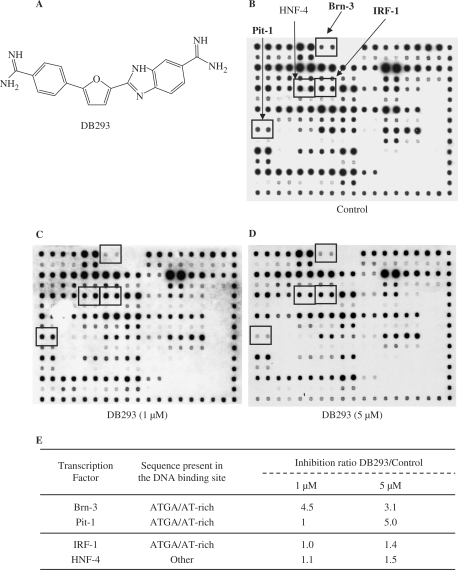
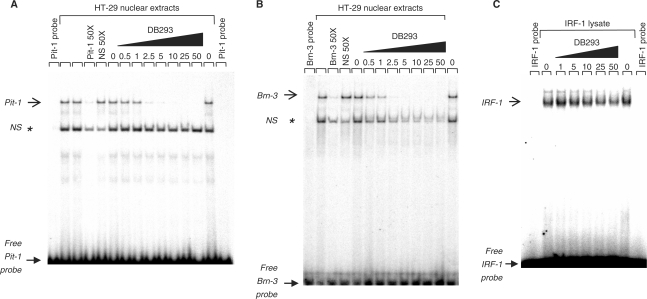
The development of small molecules to control gene expression could be the spearhead of future-targeted therapeutic approaches in multiple pathologies. Among heterocyclic dications developed with this aim, a phenyl-furan-benzimidazole dication DB293 binds AT-rich sites as a monomer and 5'-ATGA sequence as a stacked dimer, both in the minor groove. Here, we used a protein/DNA array approach to evaluate the ability of DB293 to specifically inhibit transcription factors DNA-binding in a single-step, competitive mode. DB293 inhibits two POU-domain transcription factors Pit-1 and Brn-3 but not IRF-1, despite the presence of an ATGA and AT-rich sites within all three consensus sequences. EMSA, DNase I footprinting and surface-plasmon-resonance experiments determined the precise binding site, affinity and stoichiometry of DB293 interaction to the consensus targets. Binding of DB293 occurred as a cooperative dimer on the ATGA part of Brn-3 site but as two monomers on AT-rich sites of IRF-1 sequence. For Pit-1 site, ATGA or AT-rich mutated sequences identified the contribution of both sites for DB293 recognition. In conclusion, DB293 is a strong inhibitor of two POU-domain transcription factors through a cooperative binding to ATGA. These findings are the first to show that heterocyclic dications can inhibit major groove transcription factors and they open the door to the control of transcription factors activity by those compounds.


Figures

Figure 1.
Figure 1.
Screening for the modulation of transcription factor DNA binding using TranSignal protein/DNA array I. (A) Structure of DB293 compound. (B–D) Membrane of protein DNA/array I. The mixture of TranSignal biotinylated oligonucleotides was incubated with HT-29 nuclear extracts in the absence (B, control) or presence of 1 µM (C) or 5 µM (D) of DB293. (E) Inhibition ratio for the transcription factor/DNA-binding activities induced by DB293. The DNA-binding activity of these transcription factors is specified: ‘ATGA’ corresponds to a consensus-binding sequence containing an ATGA site and ‘other’ to a consensus-binding site that contains neither an ATGA nor an AT-rich site. The values correspond to the ratio between the analyses performed in the presence or absence of the drug, after normalization of the points relative to the internal controls (right and bottom lanes in Figure 1B–D).
Figure 2.
Figure 2.
EMSAs for the inhibition of transcription factors/DNA complex formation by DB293. Radiolabeled Pit-1 (A), Brn-3 (B) or IRF-1 (C) oligonucleotides were incubated alone (lanes ‘probe’), with HT-29 nuclear extracts (A and B) or IRF-1 protein expressed in reticulocyte lysate (C), in the absence (lanes ‘0’) or presence of increasing concentrations of DB293 as specified on the top of the lane (µM). Full arrows and open arrows correspond to the free radiolabeled-DNA probe and the specific protein/DNA complex, respectively. A 50-fold concentration of specific or nonspecific (NS) nonlabeled probe relative to the radiolabeled specific DNA probe were used to illustrate the specificity of the protein/DNA complexes. The positions of NS protein/DNA complexes observed in the presence of nuclear extracts are shown using an asterisk (*).
Figure 3.
Figure 3.
DNaseI footprinting of DB293 on Pit-1, Brn-3 and IRF-1 consensus-binding sites. The concentration (µM) of the drug is shown at the top of the appropriate lanes. Control tracks labeled ‘DNA’ contained no drug. Tracks labeled ‘G’ represent dimethyl sulfate-piperidine-treated DNA sample exemplifying guanines location. The cloned sequences containing the various consensus-binding sites in the context of that used in the TranSignal DNA array approach are located between two arrows (formula image
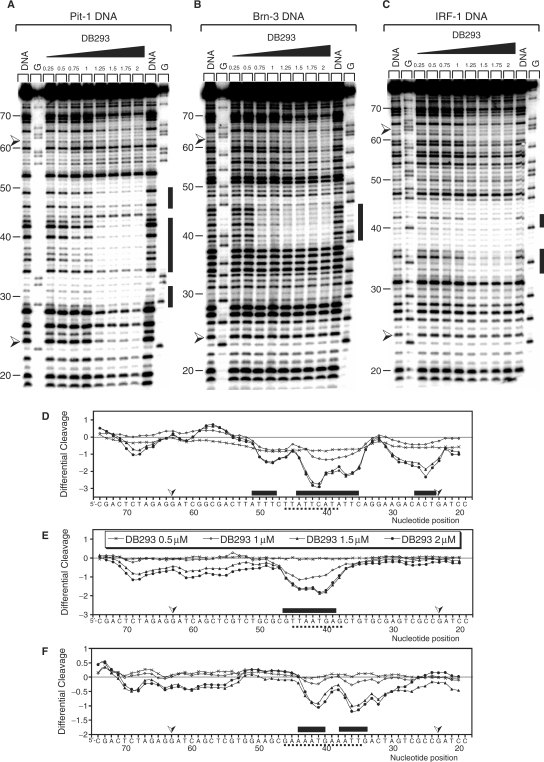
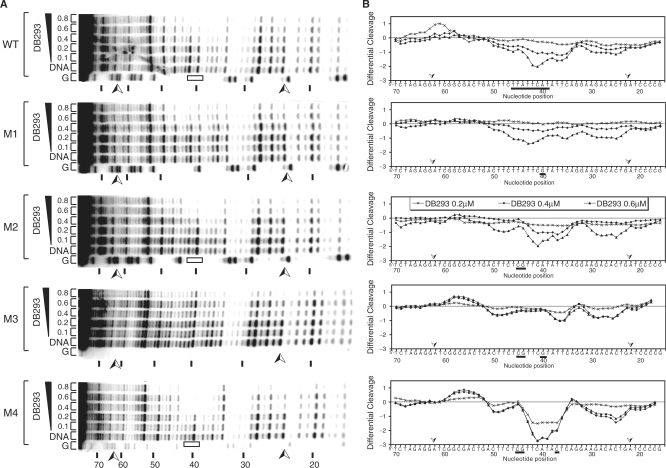
). Pit-1 cloned site is inverted in comparison with that for Brn-3 and IRF-1 consensus-binding sites. The localization of the footprints is specified using black boxes on the gels (A–C) and on the respective densitometric analysis (D–F). The plots are expressed as the ln (0.5, 1, 1.5 or 2 µM) of DB293/control DNA alone.
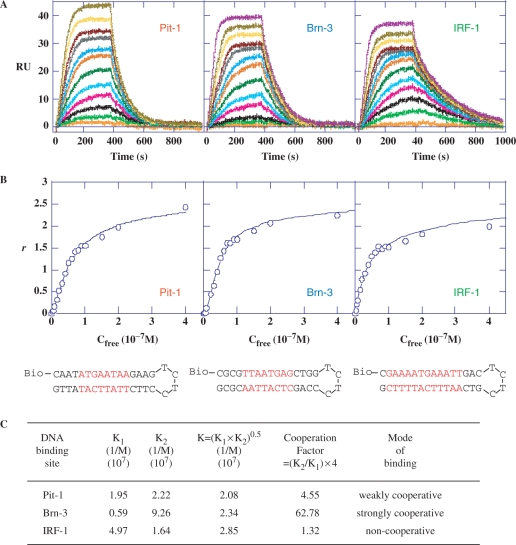
Figure 4.
Figure 4.
SPR analysis of the DB293 interaction to the various transcription factors binding sites. (A) SPR sensorgrams for binding of increasing concentrations of DB293 (from 1 nM to 0.4 µM, bottom to top of the curves) to the minimal Pit-1, Brn-3 and IRF-1 consensus-binding sites within biotinylated hairpin oligonucleotides. (B) Binding plots derived from SPR sensorgrams used to calculate the affinity constants for DB293 bound to the various sequences (see Material and methods section). The sequence and structure of the DNA sequences used are presented at the bottom of the figures. The specific consensus-binding sites are specified in red. (C) Equilibrium constants for DB293 binding to Pit-1, Brn-3 and IRF-1 minimal consensus-binding sites. The deduced cooperativity factor is used to identify the potential cooperativity of DB293 molecules for DNA binding. A weak nonspecific binding that was a factor of 10–50-fold less than the strong consensus binding was also obtained but could not be accurately determined.
Figure 5.
Figure 5.
DNaseI footprinting of DB293 derivatives on wild-type or mutated Pit-1 minimal consensus-binding site. (A) The WT or various mutated radiolabeled DNA fragments were incubated with the amount of drug specified (µM) prior to digestion by DNaseI. Lanes ‘DNA’ and ‘G’, arrows and blacks boxes are as described in Figure 3. Differential cleavage plots derived from the gels are presented in (B). White boxes localize the ATGA site on the gels. The mutated bases are underlined. Negative values correspond to a ligand-protected site and positive values represent enhanced cleavage.
Figure 6.
Figure 6.
SPR analysis of the DB293 interaction with wild-type or various mutated Pit-1 transcription factor binding sites. (A) SPR sensorgrams for binding of increasing concentrations of DB293 (1 nM to 0.4 µM) to the wild-type (WT) Pit-1 consensus-binding sites (red) or mutated sequences Pit-1-M1 (blue) or Pit-1-M2 (purple) sequences within biotinylated hairpin oligonucleotides in MES buffer, 25°C. The minimal consensus-binding sites are visualized in red. (B) Binding plots derived from SPR sensorgrams used to calculate the affinity constants for DB293 bound to the various sequences. Written in red are the specific consensus-binding sites with mutation points in blue (M1, removing the ATGA) or purple (M2, removing the AT-rich sequence 3′ to the ATGA). (C) Equilibrium constants for DB293 binding to Pit-1-WT, Pit-1-M1 and Pit-1-M2 sequences. The deduced cooperativity factor identifies the potential cooperativity of DB293 molecules for DNA binding. A weak nonspecific binding (factor of 10- to 50-fold less than the strong consensus binding) was also obtained but could not be accurately determined.
Figure 7.
Figure 7.
Electrophoretic mobility shift assays for the binding of Pit-1 transcription factor on wild-type or mutated consensus-binding sequence. (A) Radiolabeled WT or M1 to M6 Pit-1 oligonucleotides specified on the top of the lanes were incubated alone or with HT-29 nuclear extracts. Full and open arrows are as specified in Figure 2. Nonspecific (NS) protein/DNA complexes, localized using an asterisk (*), are observed using those oligonucleotides which are longer than that used for Figure 2 and were identified using a 50-fold concentration of specific or NS nonlabeled probes relatively to the radiolabeled specific DNA probe (data not shown). (B) The central part of the various sequences is presented with arrows exemplifying the importance of the relative mutation points.
Figure 8.
Figure 8.
Diagrams for hypothesized positioning of the protein and identified binding of DB293 on the various consensus-binding sites. The position of DB293 over IRF-1 (A), Brn-3 (B) and Pit-1 (C) consensus-binding sites (in red) are presented as black boxes stacking as monomers or dimers in the minor groove of the DNA. The points of interaction between the amino acids implicated in the DNA recognition and the specific target sequences are presented as dashed lanes. The water molecules implicated in the interaction are presented as full circles. In blue or pink are the DNA bases implicated in the protein direct interaction. Blue and pink dashed lanes correspond to interaction bonds within the major groove of the DNA whereas purple dashed lanes correspond to interaction bonds within the minor groove.

References

    1. Uil TG, Haisma HJ, Rots MG. Therapeutic modulation of endogenous gene function by gents with designed DNA-sequence specificities. Nucleic Acids Res. 2003;31:6064–6078. - PMC - PubMed
    1. Gniazdowski M, Denny WA, Nelson SM, Czyz M. Transcription factors as targets for DNA-interacting drugs. Curr. Med. Chem. 2003;10:909–924. - PubMed
    1. Gniazdowski M, Denny WA, Nelson SM, Czyz M. Effects of anticancer drugs on transcription factor-DNA interactions. Expert Opin. Ther. Targets. 2005;9:471–489. - PubMed
    1. D’Incalci M, Brunelli D, Marangon E, Simone M, Tavecchio M, Gescher A, Mantovani R. Modulation of gene transcription by natural products—a viable anticancer strategy. Curr. Pharm. Des. 2007;13:2744–2750. - PubMed
    1. Wemmer DE, Dervan PB. Targeting the minor groove of DNA. Curr. Opin. Struct. Biol. 1997;7:355–361. - PubMed

Publication types

MeSH terms