. 2008 Jun;36(10):3320-31.
doi: 10.1093/nar/gkn207. Epub 2008 Apr 24.

A G-tract element in apoptotic agents-induced alternative splicing

Affiliations

A G-tract element in apoptotic agents-induced alternative splicing

Yan Hai et al. Nucleic Acids Res. 2008 Jun.

Abstract

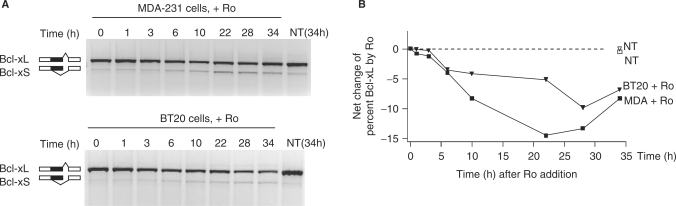
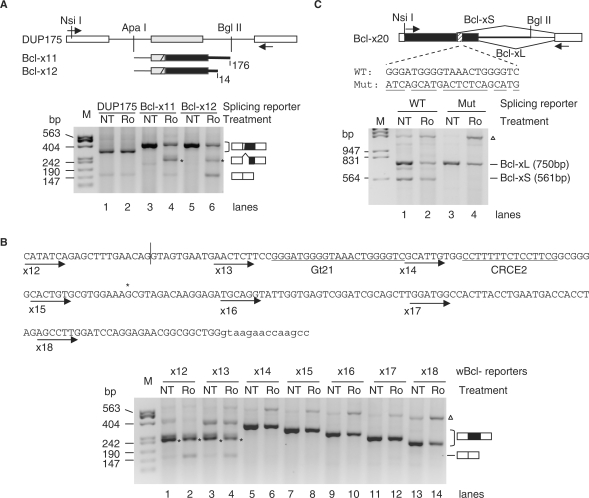
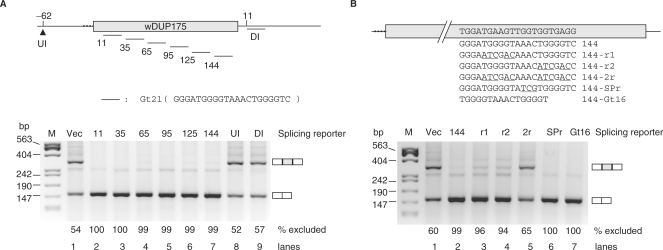
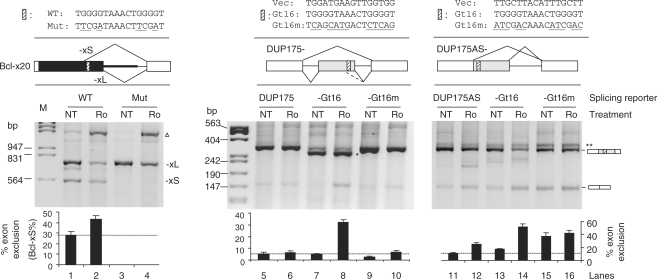
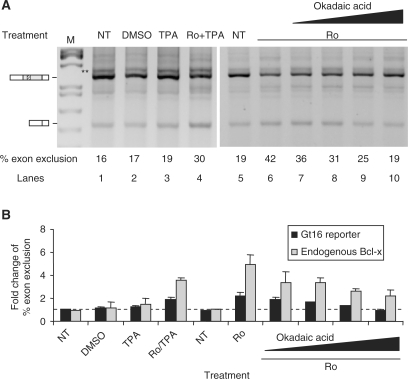
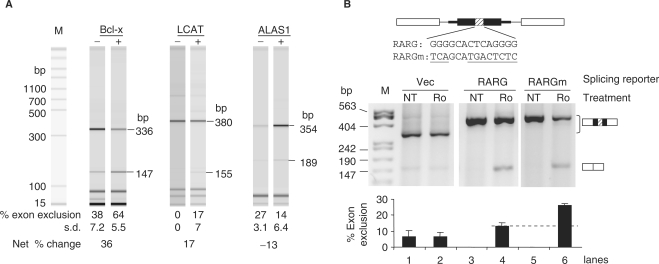
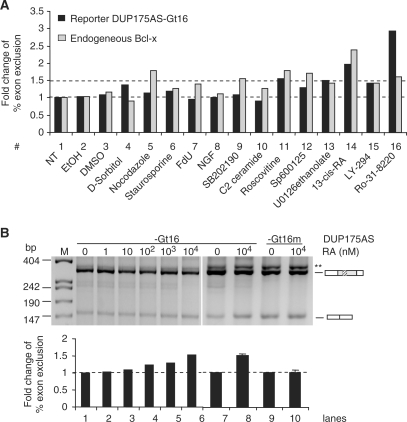
Alternative splicing of a single pre-mRNA transcript can produce protein isoforms that promote either cell growth or death. Here we show that Ro-31-8220 (Ro), an apoptotic agent that inhibits protein kinase C and activates the c-Jun N terminal kinase, decreased the proportion of the cell growth-promoting Bcl-xL splice variant. Targeted mutagenesis analyses narrowed down a critical sequence to a 16-nt G-tract element (Gt16). Transferring this element to a heterologous gene conferred Ro response on an otherwise constitutive exon. The Ro effect was reduced by okadaic acid, an inhibitor of protein phosphatases PP1 and PP2A, in a concentration-dependent manner. Search in the human genome followed by RT-PCR identified a group of genes that contain similar exonic G-tract elements and are responsive to Ro. Moreover, the Gt16 element also mediates the regulation of alternative splicing by other cell apoptosis-inducers particularly retinoic acid. Therefore, the G-tract element likely plays a role in the apoptotic agents-induced alternative splicing of a group of genes. The functions of these genes imply that this regulation will have impact on cell growth/death.


Figures

Figure 1.
Figure 1.
Ro decreases the proportion of the Bcl-xL product. (A) Agarose gels of the RT-PCR products of Bcl-x from RNA samples of MDA-231 (upper) or BT20 (lower) cells incubated with Ro for different time intervals, with Bcl-x splicing patterns indicated to the left. (B) A graphed time course of the net changes of the percentages of the Bcl-xL product relative to the starting time (0 h), in MDA-231 (squares) or BT20 (triangles) cells. The dotted line marks the starting baseline level of the Bcl-xL product in the NT samples of each cell line. The final concentration of Ro was 2 µg/ml. Ro, Ro-31-8220; NT, nontreated, control for Ro, which was dissolved in DMEM.
Figure 2.
Figure 2.
A G-tract region in Bcl-x is essential for the Ro-induced reduction of the Bcl-xL product. (A) (Upper) Diagram of the control splicing reporter DUP175 and cloned inserts of the Bcl-x minigene splicing reporters. Boxes represent exons and lines introns. Black boxes represent the Bcl-xL exon and black heavy lines Bcl-x intron. In the Bcl-x constructs, 51-nt β-globin exon sequence was fused with the exon 2 of Bcl-x containing 20-nt Bcl-xS, the 189-nt Bcl-xL exons and different lengths (nt) of the downstream introns as indicated. ApaI and BglII are the cloning sites. The arrows indicate locations of PCR primers. (Bottom) An agarosel gel of RT-PCR products from HEK293T cells transfected with the splicing reporters (as indicated above the gel) and treated with Ro or without (NT). The spliced products are diagramed to the right of the gel. Gel representative of at least three samples for each lane. (B) (Upper) Bcl-x sequence included in wBcl-x12 and other reporters. Exon sequences are in upper cases and intron in lower cases. The vertical line marks the 5′ splice site exon–intron junction for Bcl-xS. The starts of the arrow lines indicate the Bcl-x insert starting positions in each splicing reporter minigene (with reporter numbers below the arrows). In these wBcl-x reporters, the upstream 3′ splice site of the middle exons was replaced with a weaker sequence (see Materials and methods section) for a stronger Ro effect. (Bottom) Similar to the gels in (A) except with different splicing reporters as indicated above the gel. The 21-nt G-tract region (Gt21) to be examined and the CRCE2 sequence required for ceramide-regulation of Bcl-x splicing is underlined. (C) Role of the G-tract region in Ro-induced Bcl-xL reduction in its alternative 5′ splicing context. (Upper) Diagram of the Bcl-x20 splicing reporter with the Bcl-x exon 2 (black box, including the 189-nt Bcl-xL sequence) and downstream intron (514 nt, heavy line) cloned between the Nsi I and Bgl II sites of DUP175. The splicing patterns and the wild-type and mutant (mutated nts underlined) sequences of the G-tract region are as indicated. Arrows: locations of PCR primers. (Lower) An agarose gel of the RT-PCR products from cells transfected with the splicing reporters without treatment (NT) or treated with Ro (Ro) as indicated above the gel, with molecular size markers to the left and splicing products (sizes) to the right. Cells were treated with 2 µg/ml Ro or nontreated (NT) for overnight. *Product from cryptic 3′ splice site as indicated to the right of the gels or the cryptic splice position in the sequence. Gel representative of two experiments; open triangle, product resulted from pre-mRNA or plasmid; M, molecular size marker (bp).
Figure 3.
Figure 3.
The G-tract element is an exonic silencer. (A) (Upper) Diagram of Gt21 inserted into (arrowhead) or replaced (short horizontal lines) vector sequences at the indicated positions in or flanking the wDUP175 middle exon. The exonic position numbers indicate the 5′ first nt of the element, counted from the first nt of the exon. The intronic positions are relative to the last (upstream, UI) or first (downstream, DI) nt of the intron. (Bottom) An agarose gel of RT-PCR products of HEK293T cells transfected with the splicing reporters as indicated above the gel. (B) (Upper) Diagram of the splicing reporters with mutations within the Gt21 reporter 144 as in (A). Bcl-x G-tract and mutant (underlined) sequences are aligned under the replaced β-globin sequence (top, in the exon). (Bottom) Similar to that in (A) except for different reporters as indicated above the gel. Vec, wDUP175. Dotted lines refer to the weakened 3′ splice site. Gels representative of two or three samples per lane. The exon-included or -excluded products are indicated to the right of each gel. Percentages of exon-excluded products are below each lane.
Figure 4.
Figure 4.
The 16-nt G-tract element ‘TGGGGTAAACTGGGGT’ is essential for Bcl-xL and sufficient for a heterologous exon to be repressed by Ro. Shown are agrose gels of RT-PCR products of HEK293T cells transfected with splicing reporter minigenes with the element sequences and splicing patterns indicated above the gels. Bar graphs of the average percent (± SD, n = 3) exon exclusion for each sample are below the gels. The dotted horizontal lines mark the exon exclusion levels of the vectors. Cells were treated with 2 µg/ml Ro or nontreated (NT) for overnight. *A cryptic 5′ splice product with 38-nt deletion at the 3′ end of the middle exon (as indicated by the dotted line in the diagram above the gel); **likely heteroduplex formed between the two splice variant products; open triangle, same as in Figure 2.
Figure 5.
Figure 5.
Okadaic acid inhibits Ro-regulation of alternative splicing through the G-tract element. Shown are agarose gels of RT-PCR products of DUP175AS-Gt16 reporter from HEK293T cells treated with or without (NT) chemicals as indicated above the gels (A), with the average percentages of the exon-excluded products indicated under each lane. Below (B) is a bar graph of fold changes (average ± SD, n ≥ 3, relative to the nontreated NT sample for each reporter, black bars) of the percentages of exon-excluded products for each lane. Similarly obtained fold changes of the percent exon exclusion of the endogenous Bcl-x (gray bars) from the same samples are also shown beside the bars for each reporter in the graph. The dotted line marks the NT sample level. Ro: Ro-31-8220 (2 µg/ml). DMSO: vehicle for TPA. The okadaic acid concentrations, from left to right, were 20, 100, 500 and 1000 nM. TPA concentration: 120 ng/ml. **Same as in Figure 4.
Figure 6.
Figure 6.
Ro-regulation of other G-tract-containing exons. (A) Electropherograms from an automated workstation of RT-PCR products of the G-tract-containing genes from RNA samples of MDA-231 cells treated without (–) or with (+) Ro (2 µg/ml) for 22 h. Indicated above the electropherograms are the respective gene names, below are the average percentages (± SD, n ≥ 3) of the molar amount of exon-excluded products and the net changes for each gene after Ro treatment, and to the right are the sizes (bp) of the PCR products. Molecular size (bp) markers (M) are aligned on the right side. LCAT: lecithin-cholesterol acyltransferase; ALAS1: aminolevulinate, delta-, synthase 1. (B) Agarose gels of RT-PCR assay showing the splicing changes of the reporters as indicated above the gels. RARG, retinoic acid receptor, gamma; Vec, DUP175. Below the gel is a bar graph of the average percentages (± SD, n = 3) of exon-excluded products of each lane. The dotted line marks the exon exclusion levels of the G-tract wild-type reporters induced by Ro.
Figure 7.
Figure 7.
The G-tract element also mediates the regulation of splicing by other apoptotic inducers. (A) A bar graph of fold changes (relative to NT sample #1) of percent exon exclusion of DUP175AS-Gt16 and endogenous Bcl-x of HEK293T cells treated with or without (NT) chemicals as indicated. The dotted lines mark the percent exon exclusion level of the NT sample (lower) or the 1.5 fold change level (upper). FdU, 5′-Fluoro-deoxyuridine; NGF, nerve growth factor; ETOH, ethanol (vehicle for #6, 9, 10 and 11); DMSO, vehicle for #5 and #12–15. The final concentrations of the chemicals are (#4–16): 400 mM, 1 µg/ml, 20 µM, 150 µM, 50 ng/ml, 10 µM, 10 µM, 20 µM, 30 µM, 10 µM, 20 µM, 50 µM and 2 µg/ml, respectively. (B) Dosage- and Gt16-dependent effect of RA on the alternative 5′ splice site usage of the DUP175AS-Gt16. Shown are agarose gels of the splicing reporters in the presence of various concentrations of RA as indicated above the gels. Below is a bar graph of the fold changes of percent exon exclusion products relative to lane 1. The dotted line marks the level of the samples without RA. Error bar: standard deviation (n = 3 and 2, for lanes 7, 8 and 9, 10, respectively). **Same as in Figure 4.

Similar articles

Cited by

References

    1. Maniatis T, Tasic B. Alternative pre-mRNA splicing and proteome expansion in metazoans. Nature. 2002;418:236–243. - PubMed
    1. Black DL. Protein diversity from alternative splicing: a challenge for bioinformatics and post-genome biology. Cell. 2000;103:367–370. - PubMed
    1. Black DL. Mechanisms of alternative pre-messenger RNA splicing. Annu. Rev. Biochem. 2003;27:27. - PubMed
    1. Graveley BR. Alternative splicing: increasing diversity in the proteomic world. Trends Genet. 2001;17:100–107. - PubMed
    1. Jiang ZH, Zhang WJ, Rao Y, Wu JY. Regulation of Ich-1 pre-mRNA alternative splicing and apoptosis by mammalian splicing factors. Proc. Natl Acad. Sci. USA. 1998;95:9155–9160. - PMC - PubMed

Publication types

MeSH terms