. 2008 Jun 15;586(12):2961-73.
doi: 10.1113/jphysiol.2007.150367. Epub 2008 Apr 25.

Acute effects of oestrogen on the guinea pig and human IKr channels and drug-induced prolongation of cardiac repolarization

Affiliations

Acute effects of oestrogen on the guinea pig and human IKr channels and drug-induced prolongation of cardiac repolarization

Junko Kurokawa et al. J Physiol. .

Abstract

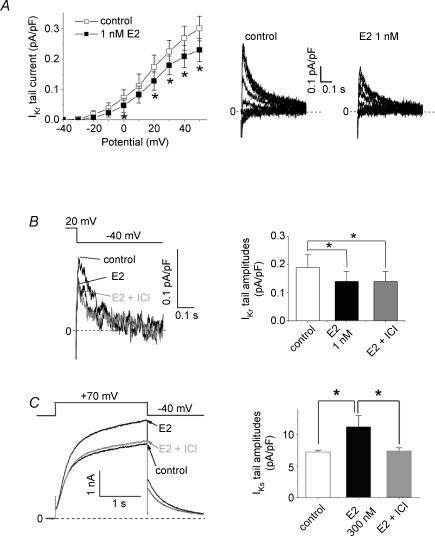
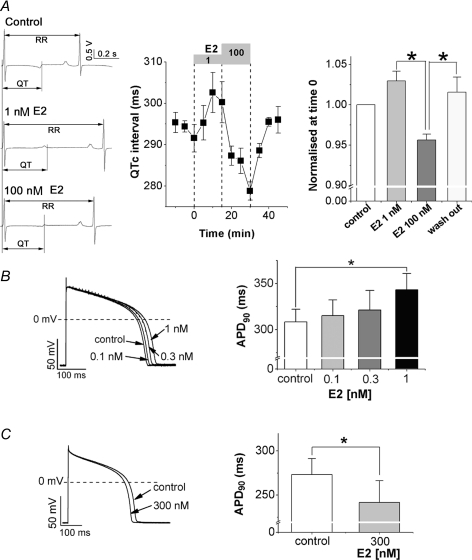
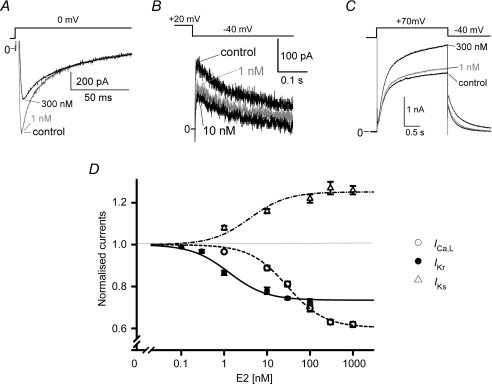
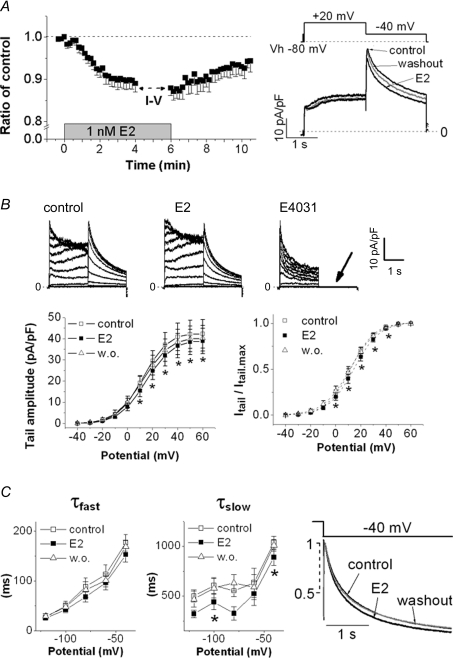
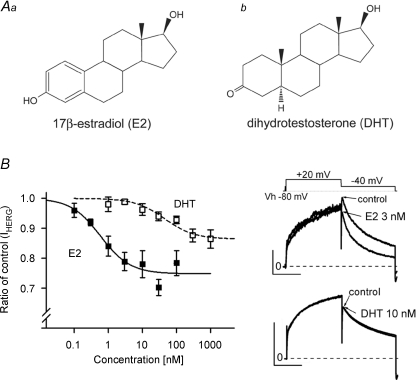
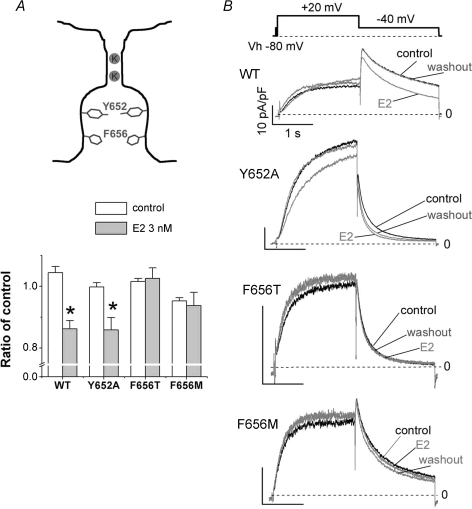
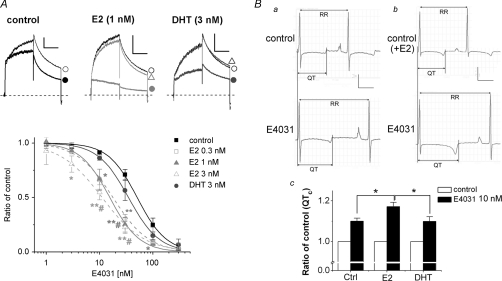
Female gender is a risk factor for drug-induced arrhythmias associated with QT prolongation, which results mostly from blockade of the human ether-a-go-go-related gene (hERG) channel. Some clinical evidence suggests that oestrogen is a determinant of the gender-differences in drug-induced QT prolongation and baseline QT(C) intervals. Although the chronic effects of oestrogen have been studied, it remains unclear whether the gender differences are due entirely to transcriptional regulations through oestrogen receptors. We therefore investigated acute effects of the most bioactive oestrogen, 17beta-oestradiol (E2) at its physiological concentrations on cardiac repolarization and drug-sensitivity of the hERG (I(Kr)) channel in Langendorff-perfused guinea pig hearts, patch-clamped guinea pig cardiomyocytes and culture cells over-expressing hERG. We found that physiological concentrations of E2 partially suppressed I(Kr) in a receptor-independent manner. E2-induced modification of voltage-dependence causes partial suppression of hERG currents. Mutagenesis studies showed that a common drug-binding residue at the inner pore cavity was critical for the effects of E2 on the hERG channel. Furthermore, E2 enhanced both hERG suppression and QT(C) prolongation by its blocker, E4031. The lack of effects of testosterone at its physiological concentrations on both of hERG currents and E4031-sensitivity of the hERG channel implicates the critical role of aromatic centroid present in E2 but not in testosterone. Our data indicate that E2 acutely affects the hERG channel gating and the E4031-induced QT(C) prolongation, and may provide a novel mechanism for the higher susceptibility to drug-induced arrhythmia in women.


Figures

Figure 3
Figure 3. Receptor-independent suppression of cardiac IKr currents by E2
Membrane currents were recorded from guinea pig ventricular myocytes as described in the Methods. A, effect of E2 at 1 nm on IKr tail currents (10 cells from 8 hearts). IKr tail currents were measured at −40 mV after a series of 140 ms test pulses from −40 mV to +50 mV (10 mV increments, 0.1 Hz; VH, −50 mV). Representative traces (left) are obtained by subtracting the traces in the presence of E4031 (5 μm). Plots (right) are peak amplitudes of tail currents (mean ±s.e.m.) before (control, □) and 10 min after application of drugs (▪). *P < 0.05, paired Student's t test. B, receptor-independent IKr suppression by E2. ICI182,780 was added to the external solution with E2 after testing the effect of E2 alone. Representative traces (left) and plots (right) show that application of an oestrogen receptor antagonist, ICI182,780 (10 μm), did not inhibit the IKr suppression by E2 at 1 nm (8 cells from 7 hearts). IKr tail currents were measured as described in A. *P < 0.05, ANOVA with repeated measures. C, receptor-dependent IKs enhancement by E2. The IKs enhancement by E2 (300 nm) was abolished by addition of ICI182,780 at 10 μm (4 cells from 4 hearts). Representative traces (left) show complete inhibition by the antagonist. Note that the working concentration of E2 is higher than that in B where ICI182,780 showed no effects. IKs were elicited by 2 s test pulses to +70 mV (0.1 Hz, VH−40 mV). *P < 0.05, ANOVA with repeated measures.
Figure 1
Figure 1. Bi-directional effects of E2 on QTC intervals and APD90 in guinea pig hearts
A, effects of E2 on QTC intervals measured from surface ECGs of isolated Langendorff-perfused guinea pig hearts (n = 5). Representative ECGs are shown on left. Time course (middle) and summary of data (right) show that low concentration of E2 (1 nm) prolonged QTC intervals, whereas high concentration of E2 (100 nm) shortened QTC intervals. Each concentration of E2 (numbers in nm) was applied as indicated by grey boxes above the panel (middle). The QTC intervals 15 min after application of each E2 concentration or wash-out are summarized as the ratio (mean ±s.e.m.) relative to control QTC interval before E2 application (right). *P < 0.05, Friedman test. B, effects of low concentrations of E2 on action potentials recorded from patch-clamped guinea pig ventricular myocytes (6 cells from 4 hearts). Representative traces (left) and bars (right) show that E2 prolonged APD90. E2 at 0.1, 0.3 and 1 nm were sequentially applied from the external side after ensuring stabilization of AP at each condition (5–15 min). Bars (mean +s.e.m.) represent APD90 obtained as average of 5 traces in the control and each concentration of E2. *P < 0.05, Friedman test. C, effects of a high concentration of E2 on action potentials recorded from cardiomyocytes. APD90 was significantly shortened by E2 at 300 nm (8 cells from 6 hearts). Data were obtained as described in B. Shown are representative action potential traces (left) and bars plotting APD90 (right). *P < 0.05, Wilcoxon test.
Figure 2
Figure 2. Effects of E2 on cardiac ion channels
Membrane currents are recorded from guinea pig ventricular myocytes as described in the Methods. E2 was applied cumulatively to the bath solution. A, representative ICa,L traces. ICa,L were elicited by 0 mV pulses in the absence (control) and the presence of E2 (1 or 300 nm). E2 at 300 nm suppressed ICa,L. B, representative IKr traces. IKr tail currents were measured at −40 mV after test pulses to +20 mV (0.1 Hz, VH−50 mV) in the absence (control) and the presence of E2 (1 or 10 nm). The tail amplitudes were obtained by subtracting the traces with E4031 at 5 μm. E2 at 1 nm suppressed IKr. C, representative IKs traces. IKs were elicited by +70 mV pulses in the absence (control) and the presence of E2 (1 or 300 nm). E2 at 300 nm enhanced IKs. D, summary of concentration-dependent effects of E2 on ICa,L, IKr and IKs. Curves represent the best fit of data points with Langmuir's isotherm, where Kd is the dissociation equilibrium constant and A is the drug-sensitive component. ICa,L (5 cells from 4 hearts); Kd= 29.5 nm and A= 0.40. IKr (5 cells from 5 hearts); Kd= 1.3 nm and A= 0.27. IKs (5 cells from 3 hearts); Kd= 39.4 nm and A= 0.25.
Figure 4
Figure 4. Effects of E2 on hERG gating recorded from HEK293 cells stably expressing hERG
A, E2 (1 nm) suppressed tail hERG currents. HERG tail currents were recorded at −40 mV after +20 mV test pulses (VH: −80 mV). Time course of peak tail amplitudes (left) is shown as ratios of the control, the value before the E2 application (n = 9). The break is to measure I–V relationships in B. Representative current traces are shown on right. B, positive shift of voltage-dependent hERG activation by E2. The hERG activation was studied by analysis of deactivating tail currents recorded at −40 mV after a series of 2 s test pulses (10 mV increments, 0.1 Hz). VH was −80 mV. Representative traces from a single cell before (left) and after (middle) application of E2 (1 nm), and after subsequent application of E4031 (5 μm), are shown above the plots. E4031 completely blocked hERG tail currents (arrow in the trace). Peaks of tail currents (lower left) and normalized tail currents (lower right) were plotted as function of the hERG activation (n = 9). Plots (right) were fitted with the Boltzman equation (see Methods). E2 shifted the activation curve to the positive direction. *P < 0.05, ANOVA with repeated measures. C, acceleration of hERG deactivation process by E2. After +40 mV pulses (1 s) were applied, deactivating tail currents were elicited by 3 s test pulses from −120 mV to −40 mV (20 mV increments, 0.1 Hz, VH−80 mV). Fast (τfast, left) and slow (τslow, middle) time constants of deactivation are plotted against the test potentials before (control), 5 min after application of E2, and 5 min after washout (n = 8). Normalized tail currents at −40 mV are averaged in each condition (right). *P < 0.05, ANOVA with repeated measures.
Figure 5
Figure 5. Concentration-dependent suppression of hERG currents by E2 and DHT
A, chemical structures of E2 (a) and DHT (b). Note the presence of an aromatic ring in E2, but not in DHT. B, concentration-dependent curves of hERG inhibition by E2 and DHT. HERG currents recorded from HEK293 cells stably expressing hERG were measured as indicated in Fig. 4A. Plots (mean ±s.e.m., left) are ratios of the control, the tail amplitudes before the drug application. One or two concentrations were tested in single cell. Representative traces are superimposed before (control) and after application of E2 at 3 nm (upper right) or DHT at 10 nm (lower right), showing that only E2 suppresses hERG currents. Scale, 10 pA pF−1, 1 s. Curves represent the best fit of data points with Langmuir's isotherm as in Fig. 2D. E2 (n = 3–9); Kd= 0.6 nm and A= 0.25. DHT (n = 4–7); Kd= 44.7 nm and A= 0.14.
Figure 6
Figure 6. Importance of a common drug-binding site for the hERG suppression by E2
HERG currents were recorded from CHO-K1 cells transiently expressing hERG genes as described in the Methods. A, mutagenesis study at two common drug-binding sites located in the S6 domain of the hERG channel. Both Thr-substitution (F656T) and Met-substitution (F656M) at Phe656 abolished the hERG inhibition by E2 (grey bars), which can be seen in wild type (WT) and Ala-substitution at Tyr652 (Y652A). Plots are tail currents normalized to the control currents, the value 10 min before application of E2 (3 nm). Time control values (white bars) were obtained from recordings with the same time protocol in the absence of E2. The numbers of experiments for each construct were as follows: WT, control, n = 4, and E2, n = 10; Y652A, control, n = 5, and E2, n = 10; F656T, control, n = 5, and E2, n = 10; F656M, control, n = 5, and E2, n = 6. *P < 0.05, unpaired t test versus time control. B, representative traces for the wild type, Y652A, F656T and F656M. Traces in the absence (control) or the presence of E2 (E2) are superimposed with traces after the wash-out shown in grey. Scale, 10 pA pF−1, 1 s. The voltage protocol is shown above the traces. Note that application of E2 to WT and Y652A, but not to F656T and F656M, accelerated deactivation.
Figure 7
Figure 7. Effects of E2 and DHT on sensitivity of E4031 to hERG currents and QTC intervals
A, inhibition of HERG currents by E4031 (10 nm). HERG currents were recorded from HEK293 cells as described in Fig. 4A. After the current amplitudes were stabilized by application of hormones to the control external solution, E4031 was added in the presence of hormones. Time control was performed with the same protocol, but without including hormones in the external solutions. Representative traces (upper) in the absence (open circles) or in the presence of hormones (E2 or DHT shown in open triangles) are shown by superimposing the traces before (open symbols) and after addition of E4031 (filled circles). Scale, 10 pA pF−1, 1 s. Concentration-dependent curves (lower) were drawn with fits of normalized tail amplitudes relative to the values before application of E4031 for 5 min (see Methods). IC50 values are as follows: time control (filled squares, n = 4–9); 50.6 nm, E2 at 0.3 nm (open squares, n = 3–5); 17.8 nm, E2 at 1 nm (filled triangles, n = 3–7); 15.5 nm, E2 at 3 nm (open triangles, n = 3–5); 11.2 nm, DHT at 3 nm (filled circles, n = 3–6); 34.8 nm*P < 0.05, **P < 0.01 versus time control, #P < 0.05 versus DHT, ANOVA. B, QTC intervals. E2 enhanced the magnitude of E4031 (10 nm) -induced QTC prolongation in Langendorff guinea pig hearts. Shown are representative ECG traces in the absence (a) and the presence (b) of E2 (3 nm). Scale, 0.5 V, 0.2 s. E4031-induced QTC prolongations are summarized in c. QTC intervals of Langendorff guinea pig hearts were obtained as described in Fig. 1A. Control (no hormones); n = 7, E2 at 3 nm; n = 5, DHT at 3 nm; n = 5. *P < 0.05, ANOVA.

Comment in

Similar articles

Cited by

References

    1. Abi-Gerges N, Philp K, Pollard C, Wakefield I, Hammond TG, Valentin JP. Sex differences in ventricular repolarization: from cardiac electrophysiology to Torsades de Pointes. Fundam Clin Pharmacol. 2004;18:139–151. - PubMed
    1. Bai CX, Kurokawa J, Tamagawa M, Nakaya H, Furukawa T. Nontranscriptional regulation of cardiac repolarization currents by testosterone. Circulation. 2005;112:1701–1710. - PubMed
    1. Bazett HC. The time relations of the blood-pressure changes after excision of the adrenal glands, with some observations on blood volume changes. J Physiol. 1920;53:320–339. - PMC - PubMed
    1. Clancy CE, Kurokawa J, Tateyama M, Wehrens XH, Kass RS. K+ channel structure-activity relationships and mechanisms of drug-induced QT prolongation. Annu Rev Pharmacol Toxicol. 2003;43:441–461. - PubMed
    1. Drici MD, Burklow TR, Haridasse V, Glazer RI, Woosley RL. Sex hormones prolong the QT interval and downregulate potassium channel expression in the rabbit heart. Circulation. 1996;94:1471–1474. - PubMed

Publication types

LinkOut - more resources