. 2008 Jun 20;283(25):17740-8.
doi: 10.1074/jbc.M709872200. Epub 2008 Apr 25.

Visualization of polarized membrane type 1 matrix metalloproteinase activity in live cells by fluorescence resonance energy transfer imaging

Affiliations

Visualization of polarized membrane type 1 matrix metalloproteinase activity in live cells by fluorescence resonance energy transfer imaging

Mingxing Ouyang et al. J Biol Chem. .

Abstract

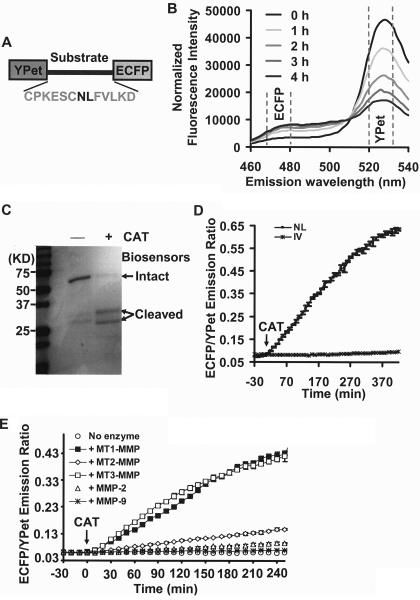
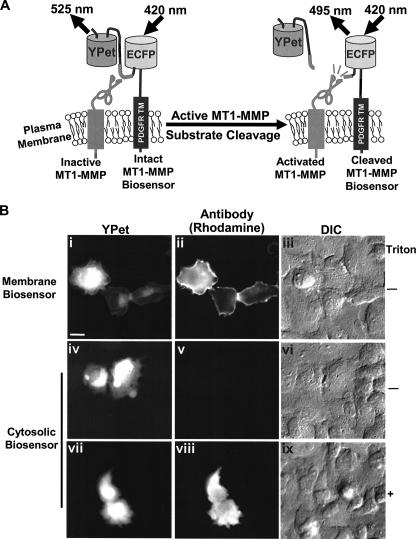
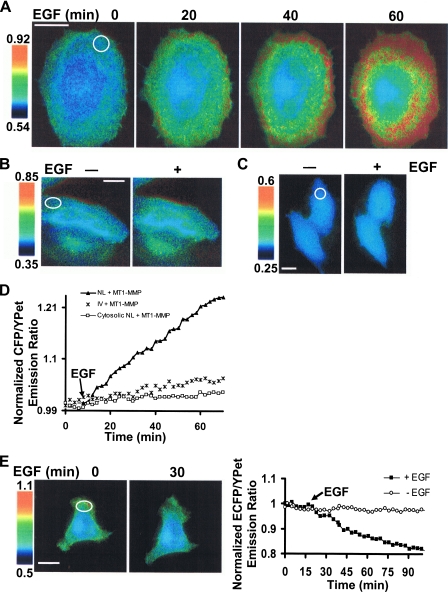
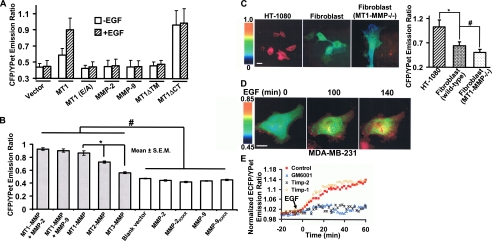
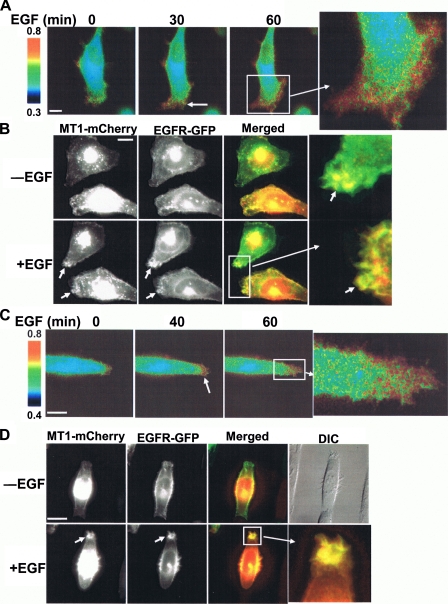
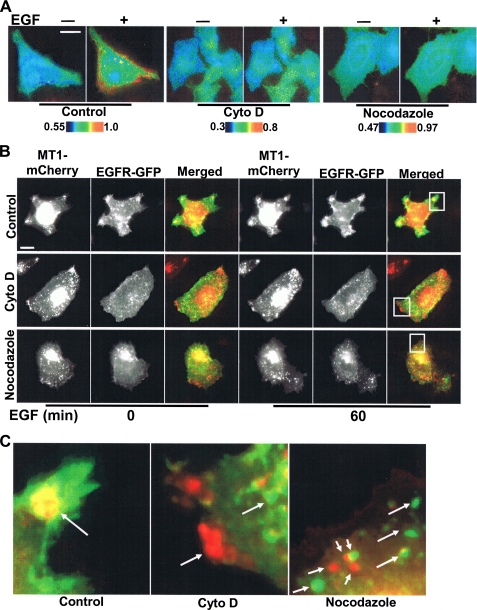
Membrane type 1 matrix metalloproteinase (MT1-MMP) plays a critical role in cancer cell biology by proteolytically remodeling the extracellular matrix. Utilizing fluorescence resonance energy transfer (FRET) imaging, we have developed a novel biosensor, with its sensing element anchoring at the extracellular surface of cell membrane, to visualize MT1-MMP activity dynamically in live cells with subcellular resolution. Epidermal growth factor (EGF) induced significant FRET changes in cancer cells expressing MT1-MMP, but not in MT1-MMP-deficient cells. EGF-induced FRET changes in MT1-MMP-deficient cells could be restored after reconstituting with wild-type MT1-MMP, but not MMP-2, MMP-9, or inactive MT1-MMP mutants. Deletion of the transmembrane domain in the biosensor or treatment with tissue inhibitor of metalloproteinase-2, a cell-impermeable MT1-MMP inhibitor, abolished the EGF-induced FRET response, indicating that MT1-MMP acts at the cell surface to generate FRET changes. In response to EGF, active MT1-MMP was directed to the leading edge of migrating cells along micropatterned fibronectin stripes, in tandem with the local accumulation of the EGF receptor, via a process dependent upon an intact cytoskeletal network. Hence, the MT1-MMP biosensor provides a powerful tool for characterizing the molecular processes underlying the spatiotemporal regulation of this critical class of enzymes.


Figures

FIGURE 1.
FIGURE 1.
In vitro characterization of the MT1-MMP biosensor. A, domain structure of MT1-MMP biosensor with a YPet and ECFP at its N and C termini connected by a substrate peptide for MT1-MMP. B, emission spectra of the MT1-MMP biosensor (excited at 437 nm) before and after incubation with the catalytic domain of MT1-MMP (CAT) for various periods of time as indicated. The broken lines highlight the regions encompassing emission maxima of ECFP and YPet. C, PAGE gel showing the sizes of MT1-MMP biosensor with or without the incubation of CAT following a 15-h incubation period. D, the time courses of ECFP/YPet emission ratio (means ± S.D.) of wild-type (▪) and mutant (NL to IV mutation; *) biosensor before and after the incubation with CAT. E, the time courses of ECFP/YPet emission ratio (mean ± S.D.) of wild-type biosensor before and after the incubation with the catalytic domains of MT1-MMP, MT2-MMP, MT3-MMP, and active MMP-2 and MMP-9, as indicated.
FIGURE 2.
FIGURE 2.
Design strategy and membrane localization of the MT1-MMP biosensor in mammalian cells. A, design strategy of the membrane-tethered MT1-MMP biosensor. The biosensor is fused to the transmembrane domain of PDGFR to position its sensing element on the extracellular surface of the plasma membrane and accessible to MT1-MMP. Active MT1-MMP can cleave the substrate peptide to separate ECFP and YPet, which leads to the observed FRET decrease. B, extracellular surface localization of the membrane-targeted MT1-MMP biosensors. HeLa cells were transfected with the membrane-targeted (panels i-iii) or cytosolic (panels iv-ix) biosensor, and stained with GFP-reactive antibodies with (panels i-vi) or without (panels vii-ix) permeabilization of the plasma membrane. panels i, iv, and vii, the fluorescence intensity image of biosensor; panels ii, v, and viii, the immunostained image of biosensors with ECFP/YPet-reactive antibody and rhodamine-conjugated secondary antibody; panels iii, vi, and ix, the differential interference contrast image of HeLa cells. Scale bar, 20 μm.
FIGURE 3.
FIGURE 3.
FRET response of the MT1-MMP biosensor in HeLa cells. A, ECFP/YPet emission ratio images of a cell co-transfected with the MT1-MMP biosensor and MT1-MMP before and after EGF as a function of time. B and C, ECFP/YPet emission ratio images of mutant (IV) (B) and cytosol-directed MT1-MMP biosensor (C) in HeLa cells before and after EGF stimulation for 60 min. D, representative time courses of normalized ECFP/YPet emission ratio in HeLa cells transfected with MT1-MMP and different MT1-MMP biosensors: the wild-type membrane-targeted (▴), mutant membrane-targeted (IV; *), or cytosol-directed (□). The emission ratios were averaged over the indicated regions of interest at the cell periphery (white circles) as shown in A-C. E, HeLa cells expressing the MT1-MMP biosensor and MT1-MMP were treated with 2.5 μg/ml TIMP-2 for 10 min before EGF stimulation. ECFP/YPet emission ratio images before and after EGF are shown on the left. Representative time course of normalized ECFP/YPet emission ratio averaged over the indicated region of interest (white circle on the left) is shown on the right together with a control time course in which cells were not exposed to EGF. In all the panels, the scale bars represent the ECFP/YPet emission ratio, with cold and hot colors representing low and high activities of MT1-MMP, respectively. Because the FRET change in the same cell before and after stimulation is studied, the dynamic ranges of scale bars are set to be similar with the absolute ratio values varying dependent on the different biosensor used.
FIGURE 4.
FIGURE 4.
The MT1-MMP biosensor monitors MT1-MMP activity. A, bar graph representing the ECFP/YPet emission ratio of HeLa cells transfected with the MT1-MMP biosensor together with different MT1-MMP mutants (MT1, wild-type MT1-MMP; MT1 (E/A), catalytically inactive MT1-MMP; MT1ΔTM, tail-deleted MT1-MMP; MT1ΔCT, transmembrane-domain-deleted MT1-MMP (13)) or other types of MMP (MMP-2 and MMP-9), before (open bars) and after (shaded bars) EGF treatment for 3 h. B, bar graph representing the ECFP/YPet emission ratio of HeLa cells transfected with the biosensor together with a control vector or different MMPs in the presence of 10% fetal bovine serum. The * and # signs represent statistically significant differences between the indicated groups. C, the ECFP/YPet emission ratio images of MT1-MMP biosensor in HT-1080 cells, wild-type or MT1-MMP-/- fibroblasts (left side). The bar graph on the right side represents the ECFP/YPet emission ratio (means ± S.D.) averaged over the whole bodies of cells. The * and # signs represent statistically significant differences between the indicated groups. D, ECFP/YPet emission ratio images of MT1-MMP biosensor before and after EGF (50 ng/ml) stimulation in MDA-MB-231 cells. E, representative time courses of normalized ECFP/YPet emission ratio of MT1-MMP biosensor averaged over the whole bodies of MDA-MB-231 cells treated with TIMP-2, TIMP-1, GM6001, or solvent control (0.1% Me2SO).
FIGURE 5.
FIGURE 5.
EGF-induced polarization of MT1-MMP activity and co-localization of MT1-MMP and EGFR at the leading edge of migrating cells. A, HeLa cells co-transfected with MT1-MMP biosensor and MT1-MMP were plated on 2 μg/cm2 fibronectin for 3 h before EGF stimulation as indicated. ECFP/YPet emission ratio images were shown to represent the distribution of MT1-MMP activity. B, MT1-MMP fused with mCherry and EGFR fused with EGFP were co-transfected into HeLa cells, plated on fibronectin, and stimulated with EGF. The images of MT1-MMP-mCherry and EGFR-EGFP were displayed and overlaid to demonstrate their co-localization at the migrating front. C, HeLa cells co-transfected with MT1-MMP biosensor and MT1-MMP were constrained on micropatterned parallel stripes (10 μm in width) coated with fibronectin before stimulation with EGF. ECFP/YPet emission ratio images are shown to represent the distribution of MT1-MMP activity. D, HeLa cells were co-transfected with MT1-MMP-mCherry and EGFR-EGFP, plated on fibronectin-coated stripes, and stimulated with EGF. The images of MT1-MMP-mCherry and EGFR-EGFP were displayed and overlaid to demonstrate their co-localization at the leading edge along the stripes. The differential interference contrast image of cells is shown in the upper right corner.
FIGURE 6.
FIGURE 6.
EGF-induced MT1-MMP activation is dependent on cytoskeletal integrity. A, HeLa cells cotransfected with the MT1-MMP biosensor and MT1-MMP were treated with Cyto D or nocodazole for 1 h before EGF stimulation. The color images represent the ECFP/YPet emission ratio of MT1-MMP biosensor before and after EGF stimulation for 60 min. B, HeLa cells co-transfected with EGFR-GFP and MT1-MMP-mCherry were treated with Cyto D or nocodazole for 1 h before EGF stimulation. The images of MT1-MMP-mCherry and EGFR-EGFP before and after EGF stimulation for 60 min were displayed and overlaid to assess the co-localization of MT1-MMP and EGFR. C, enlarged images of selected regions in B showing the overlay of MT1-MMP-mCherry and EGFR-EGFP after EGF stimulation.

Similar articles

Cited by

References

    1. Seiki, M. (2003) Cancer Lett. 194 1-11 - PubMed
    1. Visse, R., and Nagase, H. (2003) Circ. Res. 92 827-839 - PubMed
    1. Deryugina, E. I., and Quigley, J. P. (2006) Cancer Metastasis Rev. 25 9-34 - PubMed
    1. Deryugina, E. I., Ratnikov, B., Monosov, E., Postnova, T. I., DiScipio, R., Smith, J. W., and Strongin, A. Y. (2001) Exp. Cell Res. 263 209-223 - PubMed
    1. Itoh, Y., Takamura, A., Ito, N., Maru, Y., Sato, H., Suenaga, N., Aoki, T., and Seiki, M. (2001) EMBO J. 20 4782-4793 - PMC - PubMed

Publication types

MeSH terms