

Solubility of lysozyme in polyethylene glycol-electrolyte mixtures: the depletion interaction and ion-specific effects
- PMID: 18441020
- PMCID: PMC2479596
- DOI: 10.1529/biophysj.108.128694
Solubility of lysozyme in polyethylene glycol-electrolyte mixtures: the depletion interaction and ion-specific effects
Abstract
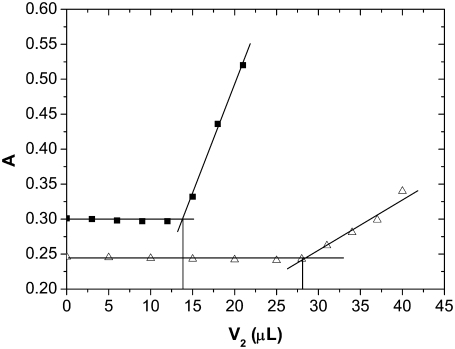
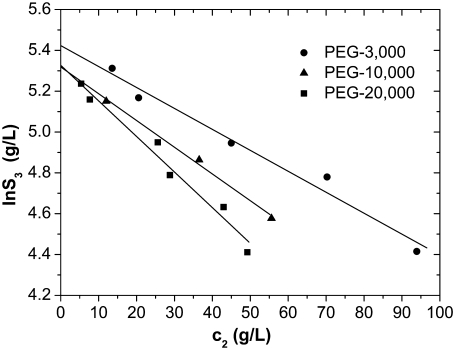
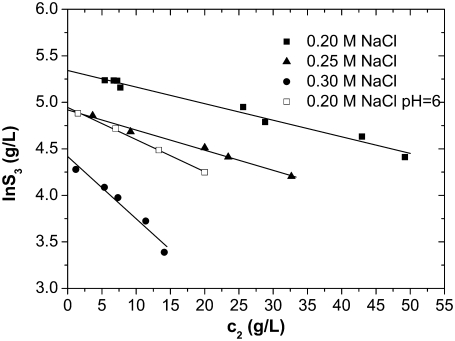
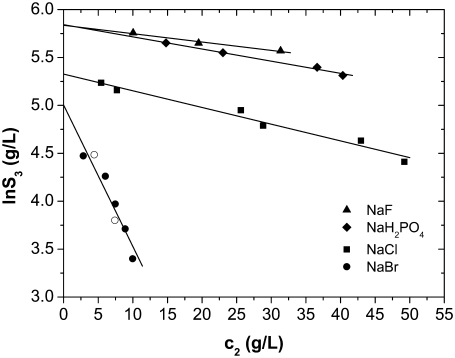
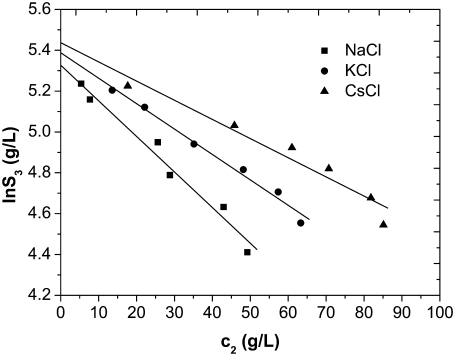
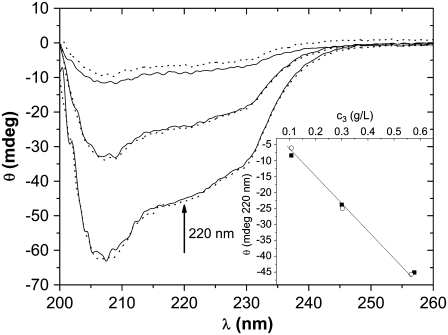
The solubility of aqueous solutions of lysozyme in the presence of polyethylene glycol and various alkaline salts was studied experimentally. The protein-electrolyte mixture was titrated with polyethylene glycol, and when precipitation of the protein occurred, a strong increase of the absorbance at 340 nm was observed. The solubility data were obtained as a function of experimental variables such as protein and electrolyte concentrations, electrolyte type, degree of polymerization of polyethylene glycol, and pH of the solution; the last defines the net charge of the lysozyme. The results indicate that the solubility of lysozyme decreases with the addition of polyethylene glycol; the solubility is lower for a polyethylene glycol with a higher degree of polymerization. Further, the logarithm of the protein solubility is a linear function of the polyethylene glycol concentration. The process is reversible and the protein remains in its native form. An increase of the electrolyte (NaCl) concentration decreases the solubility of lysozyme in the presence and absence of polyethylene glycol. The effect can be explained by the screening of the charged amino residues of the protein. The solubility experiments were performed at two different pH values (pH = 4.0 and 6.0), where the lysozyme net charge was +11 and +8, respectively. Ion-specific effects were systematically investigated. Anions such as Br(-), Cl(-), F(-), and H(2)PO(4)(-) (all in combination with Na(+)), when acting as counterions to a protein with positive net charge, exhibit a strong effect on the lysozyme solubility. The differences in protein solubility for chloride solutions with different cations Cs(+), K(+), and Na(+) (coions) were much smaller. The results at pH = 4.0 show that anions decrease the lysozyme solubility in the order F(-) < H(2)PO(4)(-) < Cl(-) < Br(-) (the inverse Hofmeister series), whereas cations follow the direct Hofmeister series (Cs(+) < K(+) < Na(+)) in this situation.
Figures
Similar articles
-
Solubility and binding properties of PEGylated lysozyme derivatives with increasing molecular weight on hydrophobic-interaction chromatographic resins.J Chromatogr A. 2010 Jul 9;1217(28):4696-703. doi: 10.1016/j.chroma.2010.05.016. J Chromatogr A. 2010. PMID: 20570270
-
Possible origin of the inverse and direct Hofmeister series for lysozyme at low and high salt concentrations.Langmuir. 2011 Aug 2;27(15):9504-11. doi: 10.1021/la202023r. Epub 2011 Jun 30. Langmuir. 2011. PMID: 21692476
-
Specific ion effects: why the properties of lysozyme in salt solutions follow a Hofmeister series.Biophys J. 2003 Aug;85(2):686-94. doi: 10.1016/S0006-3495(03)74512-3. Biophys J. 2003. PMID: 12885620 Free PMC article.
-
Non-monotonic course of protein solubility in aqueous polymer-salt solutions can be modeled using the sol-mxDLVO model.Biotechnol J. 2016 Feb;11(2):282-9. doi: 10.1002/biot.201500123. Epub 2015 Dec 17. Biotechnol J. 2016. PMID: 26579880
-
Understanding specific ion effects and the Hofmeister series.Phys Chem Chem Phys. 2022 Jun 1;24(21):12682-12718. doi: 10.1039/d2cp00847e. Phys Chem Chem Phys. 2022. PMID: 35543205 Review.
Cited by
-
Explicit-water theory for the salt-specific effects and Hofmeister series in protein solutions.J Chem Phys. 2016 Jun 7;144(21):215101. doi: 10.1063/1.4953067. J Chem Phys. 2016. PMID: 27276970 Free PMC article.
-
Ion-specificity and surface water dynamics in protein solutions.Phys Chem Chem Phys. 2018 Dec 12;20(48):30340-30350. doi: 10.1039/c8cp06061d. Phys Chem Chem Phys. 2018. PMID: 30488933 Free PMC article.
-
Protein aggregation in salt solutions.Proc Natl Acad Sci U S A. 2015 May 26;112(21):6766-70. doi: 10.1073/pnas.1507303112. Epub 2015 May 11. Proc Natl Acad Sci U S A. 2015. PMID: 25964322 Free PMC article.
-
Application of a PEG precipitation method for solubility screening: a tool for developing high protein concentration formulations.Protein Sci. 2013 Aug;22(8):1118-23. doi: 10.1002/pro.2289. Epub 2013 Jun 24. Protein Sci. 2013. PMID: 23740802 Free PMC article.
-
Modeling the depletion effect caused by an addition of polymer to monoclonal antibody solutions.J Phys Condens Matter. 2018 Dec 5;30(48):485101. doi: 10.1088/1361-648X/aae914. Epub 2018 Nov 12. J Phys Condens Matter. 2018. PMID: 30418950 Free PMC article.
References
-
- Bjurstrom, E. 1985. Biotechnology: fermentation and downstream processing. Chem. Eng. 92:126–158.
-
- Hoskins, A. R., I. D. Robb, and P. A. Williams. 1998. Selective separation of proteins from mixtures using polysaccharides. Biopolymers. 45:97–104. - PubMed
-
- Asakura, S., and F. Oosawa. 1958. Interaction between particles suspended in solutions of macromolecules. J. Polym. Sci. [B]. 33:183–192.
-
- Striolo, A., C. M. Colina, K. E. Gubbins, N. Elvasore, and L. Lue. 2004. The depletion interaction between pairs of colloidal particles in polymer solution. Mol. Simul. 30:437–449.
-
- Reščič, J., V. Vlachy, L. B. Bhuiyan, and C. W. Outhwaite. 1998. Monte Carlo simulations of a mixture of an asymmetric electrolyte and a neutral species. Mol. Phys. 95:233–242.
Publication types
MeSH terms
Substances
LinkOut - more resources
Full Text Sources
