. 2008 Apr;20(4):1088-100.
doi: 10.1105/tpc.108.058362. Epub 2008 Apr 25.

Reduced V-ATPase activity in the trans-Golgi network causes oxylipin-dependent hypocotyl growth Inhibition in Arabidopsis

Affiliations

Reduced V-ATPase activity in the trans-Golgi network causes oxylipin-dependent hypocotyl growth Inhibition in Arabidopsis

Angela Brüx et al. Plant Cell. 2008 Apr.

Abstract

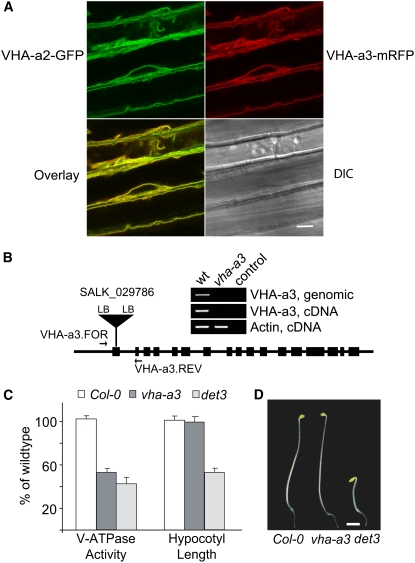
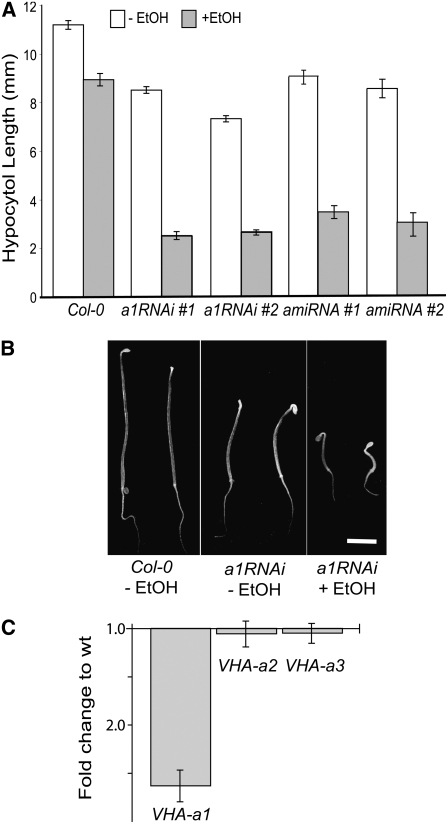
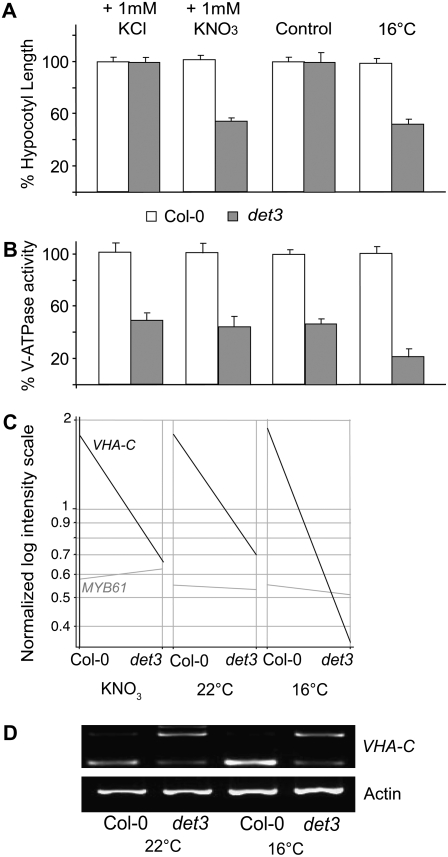
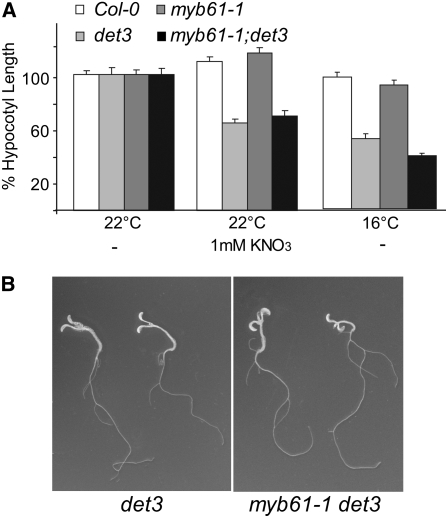
Regulated cell expansion allows plants to adapt their morphogenesis to prevailing environmental conditions. Cell expansion is driven by turgor pressure created by osmotic water uptake and is restricted by the extensibility of the cell wall, which in turn is regulated by the synthesis, incorporation, and cross-linking of new cell wall components. The vacuolar H(+)-ATPase (V-ATPase) could provide a way to coordinately regulate turgor pressure and cell wall synthesis, as it energizes the secondary active transport of solutes across the tonoplast and also has an important function in the trans-Golgi network (TGN), which affects synthesis and trafficking of cell wall components. We have previously shown that det3, a mutant with reduced V-ATPase activity, has a severe defect in cell expansion. However, it was not clear if this is caused by a defect in turgor pressure or in cell wall synthesis. Here, we show that inhibition of the tonoplast-localized V-ATPase subunit isoform VHA-a3 does not impair cell expansion. By contrast, inhibition of the TGN-localized isoform VHA-a1 is sufficient to restrict cell expansion. Furthermore, we provide evidence that the reduced hypocotyl cell expansion in det3 is conditional and due to active, hormone-mediated growth inhibition caused by a cell wall defect.


Figures

Figure 1.
Figure 1.
Reduced Tonoplast V-ATPase Activity Does Not Limit Cell Expansion. (A) Etiolated hypocotyl cells coexpressing VHA-a2-GFP and VHA-a3-mRFP. Green and red fluorescence signals represents the tonoplast of the large central vacuoles. Bar = 10 μm. DIC, differential interference contrast. (B) Structure and expression of the vha-a3 T-DNA allele; the indicated primers were used to identify homozygous plants and to demonstrate the absence of the VHA-a3 transcript. The control PCR reactions contain no input DNA. LB, left border. (C) V-ATPase activity and hypocotyl length of etiolated Col-0, vha-a3, and det3 seedlings grown on MS plates. V-ATPase activity of total microsomal extracts was measured as ConcA-sensitive ATP hydrolysis. Data from at least three independent measurements were averaged, and the value obtained for Col-0 was set to 100%. Error bars indicate sd for the enzyme activity and se for hypocotyl length. (D) Four-day-old etiolated seedlings of Col-0, vha-a3, and det3. Bar = 2 mm.
Figure 2.
Figure 2.
V-ATPase Activity in the TGN Is Necessary for Cell Expansion. (A) Hypocotyl length of 4-d-old etiolated seedlings grown in the absence or presence of ethanol. Shown are the results for Col-0 and two independent transgenic lines expressing ethanol-inducible constructs with either an RNAi or an amiRNA targeted against VHA-a1, the TGN-localized isoform of VHA-a. At least 30 seedlings of each line were measured. Error bars represent se. (B) Four-day-old etiolated seedlings of Col-0 and a homozygous, ethanol-inducible VHA-a1 RNAi line grown in the absence or the presence of 0.2% ethanol. Bar = 2 mm. (C) Quantitative RT-PCR analysis of VHA-a1, VHA-a2, and VHA-a3 transcript levels in VHA-a1 RNAi seedlings grown in the presence of ethanol. Shown is the fold downregulation in comparison to Col-0. Error bars represent sd of three technical replicates.
Figure 3.
Figure 3.
V-ATPase Inhibition Affects Golgi Morphology. Electron micrographs of Golgi stacks and their associated TGNs in high-pressure frozen and freeze-substituted root tip cortex cells of uninduced (A) and induced VHA-a1 RNAi seedlings (B). Bar = 0.25 μm.
Figure 4.
Figure 4.
Hypocotyl Growth Inhibition in det3 Can Be Induced by Nitrate and Temperature. (A) Hypocotyl length of 4-d-old etiolated seedlings grown at 22°C in the absence of external nutrients (control), in the presence of 1 mM KNO3 or 1 mM KCl, or at 16°C in the absence of external nutrients. At least 30 seedlings from each of three independent experiments were measured. Col-0 length was set to 100%. Absolute values are presented in Supplemental Table 2 online. Error bars represent se. (B) V-ATPase activity of total microsomal extracts of 4-d-old etiolated seedlings was measured as ConcA-sensitive ATP hydrolysis (see Methods). Data from at least three independent measurements were averaged, and the values obtained for Col-0 were set to 100%. Absolute values are presented in Supplemental Table 2 online. Error bars indicate sd. (C) Expression of VHA-C and MYB61 on a normalized log intensity scale. cDNA of 4-d-old etiolated Col-0 and det3 seedlings grown under permissive (22°C, 0 mM KNO3) and restrictive conditions (22°C, 1 mM KNO3; 16°C, 0 mM KNO3) was used for hybridization of the Affymetrix ATH1 microarray. (D) RT-PCR on cDNA of 4-d-old etiolated seedlings using primers flanking intron 1 of VHA-C. Primers for actin2 (see Supplemental Table 1 online) served as a control. The lower band is derived from the spliced transcripts; the upper band represents transcripts in which intron 1 is present.
Figure 5.
Figure 5.
Phenotype of the myb61 det3 Double Mutant. (A) Hypocotyl length of 4-d-old etiolated seedlings. At least 30 seedlings from each of three independent experiments were measured. Col-0 length was set to 100%. Absolute values are presented in Supplemental Table 2 online. Error bars represent se. (B) Phenotype of 14-d-old etiolated seedlings grown on MS plates with 1% sucrose.
Figure 6.
Figure 6.
Gene Expression in det3 under Permissive and Restrictive Conditions. (A) Venn diagram showing intersections between the sets of genes with at least threefold differences in expression level between det3 and Col-0. (B) Heat map displaying the responses to phytohormones and biotic stress for 20 genes showing strong deregulation in det3. ACC, 1-aminocyclopropane-1-carboxylic acid; ABA, abscisic acid; IAA, indole-3-acetic acid; MJ, MeJA. (C) Expression of genes classified as MeJA specific in 4-d-old etiolated Col-0 and det3 seedlings grown under permissive (22°C, 0 mM KNO3) and restrictive conditions (22°C, 1 mM KNO3; 16°C, 0 mM KNO3) as determined by Affymetrix ATH1 hybridization and displayed on a normalized log intensity scale. Coloring represents expression in det3 at 16°C ranging from red (normalized intensity > 5.0) to blue (normalized intensity < 0.2). (D) Schematic representation of the JA biosynthetic pathway including the fold changes in expression level between Col-0 and det3 under the two restrictive conditions used: the first number in the KNO3 condition and the second number in the 16°C condition.
Figure 7.
Figure 7.
Oxylipins Are Necessary and Sufficient for Hypocotyl Growth Inhibition. (A) and (B) Hypocotyl length of 4-d-old etiolated seedlings; genotype and growth conditions are indicated. At least 30 seedlings from each of three independent experiments were measured. Wild-type length was set to 100%. Error bars represent se. (C) Amount of OPDA, JA, and JA-Ile in 3-d-old etiolated Col-0 and det3 seedlings grown with (+) or without 2 mM KNO3 as analyzed by gas chromatography–mass spectrometry. Error bars indicate sd of three independent experiments. FW, fresh weight.
Figure 8.
Figure 8.
det3 Has Reduced Amounts of Cellulose and Is Hypersensitive to Inhibitors of Cellulose Synthase. (A) Amount of cellulose in 4-d-old etiolated Col-0 and det3 seedlings grown under the indicated conditions. Dry weight of etiolated wild-type and det3 seedlings is not significantly different (Col-0, 43.5 ± 1.2 mg/1000 seedlings; det3, 42.9 ± 1.5 mg). Error bars indicate sd of three independent experiments. PA, phytagar. (B) Hypocotyl length of 4-d-old etiolated Col-0 and det3 seedlings grown in the absence or presence of the indicated concentrations of IXB and AVG. At least 30 seedlings from each of three independent experiments were measured. Error bars indicate se.

References

    1. Achard, P., Liao, L., Jiang, C., Desnos, T., Bartlett, J., Fu, X., and Harberd, N.P. (2007). DELLAs contribute to plant photomorphogenesis. Plant Physiol. 143 1163–1172. - PMC - PubMed
    1. Alonso, J.M., et al. (2003). Genome-wide insertional mutagenesis of Arabidopsis thaliana. Science 301 653–657. - PubMed
    1. Arioli, T., et al. (1998). Molecular analysis of cellulose biosynthesis in Arabidopsis. Science 279 717–720. - PubMed
    1. Bouton, S., Leboeuf, E., Mouille, G., Leydecker, M.T., Talbotec, J., Granier, F., Lahaye, M., Hofte, H., and Truong, H.N. (2002). QUASIMODO1 encodes a putative membrane-bound glycosyltransferase required for normal pectin synthesis and cell adhesion in Arabidopsis. Plant Cell 14 2577–2590. - PMC - PubMed
    1. Cabrera y Poch, H., Peto, C., and Chory, J. (1993). A mutation in the Arabidopsis DET3 gen uncouples photoregulated leaf development from gene expression and chloroplast biogenesis. Plant J. 4 671–682.

Publication types

MeSH terms