. 2008 Apr;20(4):856-74.
doi: 10.1105/tpc.107.055202. Epub 2008 Apr 25.

Plastid transcriptomics and translatomics of tomato fruit development and chloroplast-to-chromoplast differentiation: chromoplast gene expression largely serves the production of a single protein

Affiliations

Plastid transcriptomics and translatomics of tomato fruit development and chloroplast-to-chromoplast differentiation: chromoplast gene expression largely serves the production of a single protein

Sabine Kahlau et al. Plant Cell. 2008 Apr.

Abstract

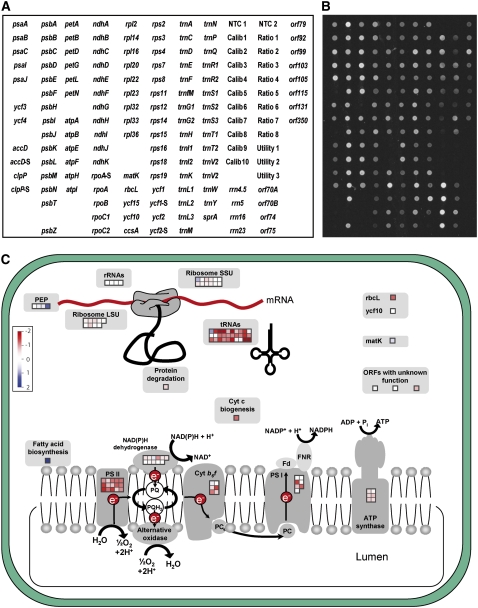
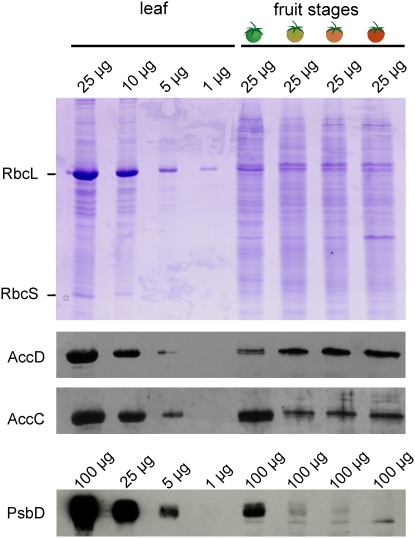
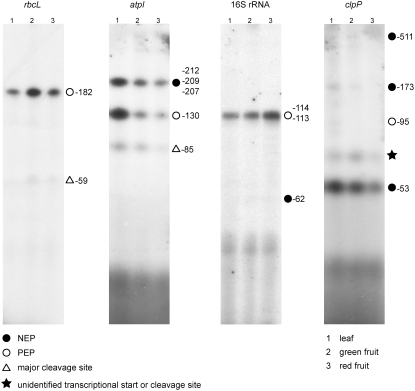
Plastid genes are expressed at high levels in photosynthetically active chloroplasts but are generally believed to be drastically downregulated in nongreen plastids. The genome-wide changes in the expression patterns of plastid genes during the development of nongreen plastid types as well as the contributions of transcriptional versus translational regulation are largely unknown. We report here a systematic transcriptomics and translatomics analysis of the tomato (Solanum lycopersicum) plastid genome during fruit development and chloroplast-to-chromoplast conversion. At the level of RNA accumulation, most but not all plastid genes are strongly downregulated in fruits compared with leaves. By contrast, chloroplast-to-chromoplast differentiation during fruit ripening is surprisingly not accompanied by large changes in plastid RNA accumulation. However, most plastid genes are translationally downregulated during chromoplast development. Both transcriptional and translational downregulation are more pronounced for photosynthesis-related genes than for genes involved in gene expression, indicating that some low-level plastid gene expression must be sustained in chromoplasts. High-level expression during chromoplast development identifies accD, the only plastid-encoded gene involved in fatty acid biosynthesis, as the target gene for which gene expression activity in chromoplasts is maintained. In addition, we have determined the developmental patterns of plastid RNA polymerase activities, intron splicing, and RNA editing and report specific developmental changes in the splicing and editing patterns of plastid transcripts.


Figures

Figure 1.
Figure 1.
Design of a Plastome Microarray for Solanaceous Plants. (A) Spotting scheme of oligonucleotide probes on the array. The array contains all genes and conserved open reading frames (ycfs) contained in solanaceous plastid genomes and, in addition, a number of nonconserved open reading frames (orfs), which, however, are unlikely to represent functional genes (Kahlau et al., 2006). Oligonucleotides are 68 to 71 nucleotides long. Poorly conserved genes are covered by more than one oligonucleotide (indicated by the suffix -S for Solanum-specific oligonucleotide). NTC, negative control to assess nonspecific background hybridization; Calib, Ratio, and Utility, calibration and reference DNAs (artificial sequences corresponding to the Lucidea Universal ScoreCard; Amersham Biosciences). See Methods for details. (B) Example of a microarray hybridization experiment with total leaf RNA showing that all genes and open reading frames are detected at sufficient sensitivity. (C) Graphical visualization of data sets using a modified version of the MapMan software (Thimm et al., 2004). All processes in which plastome-encoded gene products participate are illustrated by pictograms containing a set of boxes corresponding to the genes involved in the respective process. The order of the boxes reflects the order of the genes on the array. For example, the first row of gene boxes for ribosomal proteins of the small ribosomal subunit represents the genes rps2, rps3, rps4, rps7, rps8, and rps11, and the second row represents rps12, rps14, rps15, rps16, rps18, and rps19. Red indicates downregulated, and blue indicates upregulated, expression. Expression changes are displayed on a log2 scale. The data set shown here as an example is a comparison of RNA accumulation in light red fruits and green fruits.
Figure 2.
Figure 2.
Transcriptomics Analysis of Tomato Plastid Genome Expression. (A) and (B) Transcriptomics of fruit development. Changes in RNA accumulation in the different stages of fruit ripening (green, turning, light red, and red, as schematically depicted above the displayed array data) are shown relative to the RNA accumulation levels in green leaves. Levels of downregulation (red) or upregulation (blue) are shown on a log2 scale from −8 to +8 (corresponding to a 256-fold change in expression from 0 to −8 and 0 to +8, respectively). The total data set is displayed in (A); the data set shown in (B) is limited to those changes that are statistically significant according to the tests described in Methods. (C) and (D) Transcriptomics of chloroplast-to-chromoplast differentiation in fruit ripening. Changes in RNA accumulation during chromoplast development (turning, light red, and red ripening stages) are shown relative to the RNA accumulation levels in green, chloroplast-containing fruits. The total data set is displayed in (C); the data set shown in (D) is limited to those changes that are statistically significant according to the tests described in Methods. All data shown in (A) to (D) represent means of three independent experiments (RNA isolations). (E) Confirmation of selected changes in transcript abundance by RNA gel blot analyses. Equal amounts of RNA extracted from green leaves and the four stages of fruit ripening were separated by denaturing agarose gel electrophoresis, blotted, and hybridized to radiolabeled probes specific for psbB, rpoB, matK, psbD, and accD. To control for equal loading, the ethidium bromide–stained agarose RNA gels are shown below each blot. The plant material used for these RNA extractions was generated independently from the materials used for the three microarray experiments.
Figure 3.
Figure 3.
Translatomics Analysis of Tomato Plastid Genome Expression by Measuring the Levels of Polysome-Associated mRNAs. (A) and (B) Translatomics of fruit development. Changes in the polysome association of all plastid protein-coding genes are shown for the different stages of fruit ripening (see Figure 2) relative to the translation levels in green leaves. Blue indicates upregulation and red indicates downregulation. Expression changes are displayed on a log2 scale from −8 to +8 (corresponding to a 256-fold change in expression from 0 to −8 and 0 to +8, respectively). The total data set is displayed in (A); the data set shown in (B) is limited to those changes that are statistically significant according to the tests described in Methods. (C) and (D) Translatomics of chloroplast-to-chromoplast differentiation in fruit ripening. Changes in polysome association during chromoplast development (turning, light red, and red ripening stages) are shown relative to the translation rates in green, chloroplast-containing tomato fruits. The total data set is displayed in (C); the data set shown in (D) is limited to those changes that are statistically significant according to the tests described in Methods. All data shown in (A) to (D) represent means of two independent experiments (polysome isolations). (E) Confirmation of selected changes in polysome association by RNA gel blot analyses. Polysome gradients were fractionated into six fractions, and equal aliquots of extracted RNAs were separated by denaturing agarose gel electrophoresis, blotted, and hybridized to radiolabeled probes specific for accD and psbD. The wedges above each blot indicate the gradient from low to high sucrose concentration. As a control, a sample was treated with puromycin to cause dissociation of ribosomes from the mRNAs. The ethidium bromide–stained agarose RNA gels are shown below each blot. The plant material used for these polysome preparations was generated independently from the materials used for the two microarray experiments.
Figure 4.
Figure 4.
Confirmation of AccD Expression in Chromoplasts at the Protein Level. Protein gel blots for two subunits of the plastid acetyl-CoA carboxylase are shown: the plastid genome–encoded AccD protein and the nuclear genome–encoded AccC subunit (Sasaki et al., 1993, 1995; Madoka et al., 2002). As an example of a plastid-encoded photosynthesis protein, the photosystem II subunit PsbD was analyzed. For each protein, a dilution series of total leaf protein was compared with total proteins extracted from the four stages of fruit ripening. To control for correct protein quantitation, a Coomassie blue–stained polyacrylamide gel is also shown. The two subunits of ribulose-1,5-bis-phosphate carboxylase/oxygenase (RbcL and RbcS), representing the most abundant proteins in green leaves, are labeled. Note that while the PsbD protein is undetectable in chromoplast-containing tomato fruits, the AccD protein still accumulates in ripe red fruits.
Figure 5.
Figure 5.
Developmental Analysis of Plastid RNA Polymerase Activities by Determining PEP and NEP Promoter Usage in Leaves and Green and Red Tomato Fruits. Transcriptional start sites for the rbcL, atpI, rrn16, and clpP genes were determined by primer extension analysis. PEP promoters, NEP promoters, and RNA processing sites for the genes analyzed here were identified previously (Allison et al., 1996; Hajdukiewicz et al., 1997). Note that not all previously characterized 5′ ends were identified here, because some 5′ ends represent lowly abundant transcript species or are only detectable in a PEP knockout genetic background (Allison et al., 1996; Hajdukiewicz et al., 1997).
Figure 6.
Figure 6.
Developmental Analysis of Plastid Intron Splicing and Processing of Polycistronic Transcripts by Intercistronic Cleavage. RNA gel blots with probes specific for the transcripts indicated above each blot are shown. Introns are symbolized as open boxes, intron-free genes in polycistronic mRNAs are shown as closed boxes, and exons of intron-containing genes are depicted as shaded boxes. Lariats are indicated by circles. Asterisks denote mature (fully spliced) transcripts. Roman numerals above the shaded boxes indicate exon numbers. To control for equal loading, RNA gels are shown below each blot. Note that unspliced precursors are not detectable for petD and for the two introns of rps12 (the first of which is trans-spliced and the second cis-spliced). The processing patterns remain essentially unchanged during the four fruit ripening stages (lane 2, green fruit; lane 3, turning; lane 4, light red; lane 5, red) compared with green leaves (lane 1). Likewise, the splicing efficiency of the clpP and trnI-GAU introns does not change significantly during development, whereas the splicing efficiency of the ndhB intron declines during fruit development and the ndhB transcript remains largely unspliced in ripe red tomatoes.
Figure 7.
Figure 7.
Developmental Analysis of Plastid RNA Editing. Editing at selected sites of the plastid ndhB, ndhF, and ndhD mRNAs is shown below the corresponding DNA sequences for a developmental series including green leaves and five different fruit stages. Editing sites are denoted by arrows pointing to the corresponding peak in the sequencing chromatogram. Note that C-to-U editing at ndhB site 279 and ndhD site 225 is complete in all developmental stages, whereas editing at ndhB sites 196 and 277 and ndhF site 97 is only partial in fruits. The ndhD sites 1 and 200 remain virtually completely unedited in fruits, with the exception of site 1, which is still partially edited in very young fruits. The relative sizes of the letters C and T above each editing site in the sequence chromatograms symbolize the editing efficiency as evidenced by relative peak intensities. Note that in some cases, the C and T peaks overlap exactly due to the presence of approximately equal amounts of edited and unedited mRNAs (ndhB-196 in red fruits, ndhB-277 in green and light red fruits, and ndhF-97 in green and red fruits).

Similar articles

Cited by

References

    1. Allison, L.A., Simon, L.D., and Maliga, P. (1996). Deletion of rpoB reveals a second distinct transcription system in plastids of higher plants. EMBO J. 15 2802–2809. - PMC - PubMed
    1. Barkan, A. (1989). Tissue-dependent plastid RNA splicing in maize: Transcripts from four plastid genes are predominantly unspliced in leaf meristems and roots. Plant Cell 1 437–445. - PMC - PubMed
    1. Barkan, A. (1998). Approaches to investigating nuclear genes that function in chloroplast biogenesis in land plants. Methods Enzymol. 297 38–57.
    1. Barkan, A., and Goldschmidt-Clermont, M. (2000). Participation of nuclear genes in chloroplast gene expression. Biochimie 82 559–572. - PubMed
    1. Bathgate, B., Purton, M.E., Grierson, D., and Goodenough, P.W. (1985). Plastic changes during the conversion of chloroplasts to chromoplasts in ripening tomatoes. Planta 165 197–204. - PubMed

Publication types

LinkOut - more resources