

Immunolocalization of Kim-1, RPA-1, and RPA-2 in kidney of gentamicin-, mercury-, or chromium-treated rats: relationship to renal distributions of iNOS and nitrotyrosine
- PMID: 18441258
- PMCID: PMC2745064
- DOI: 10.1177/0192623308315832
Immunolocalization of Kim-1, RPA-1, and RPA-2 in kidney of gentamicin-, mercury-, or chromium-treated rats: relationship to renal distributions of iNOS and nitrotyrosine
Abstract
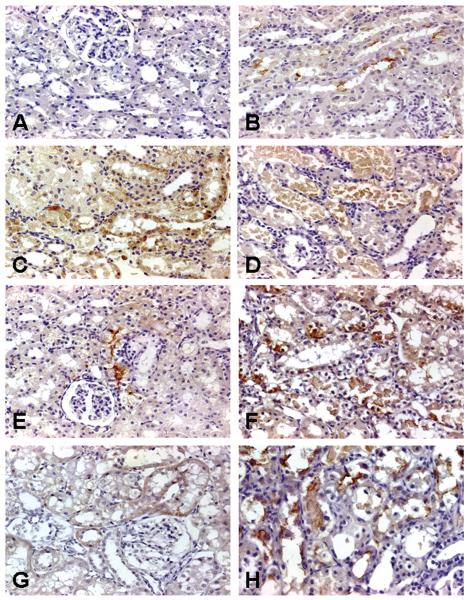
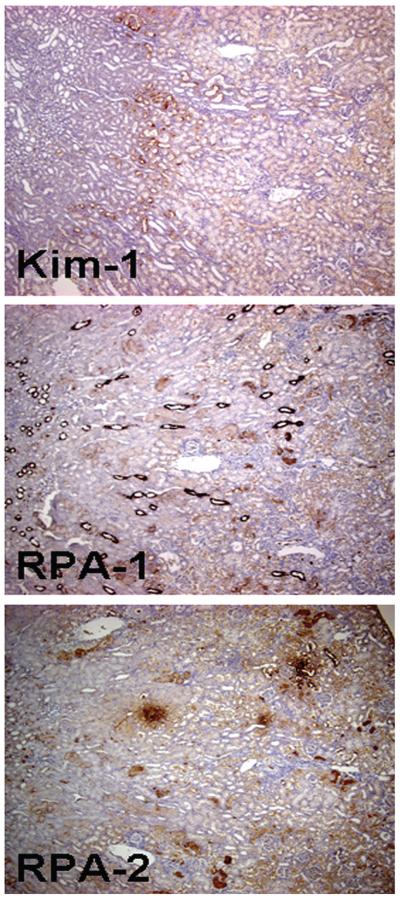
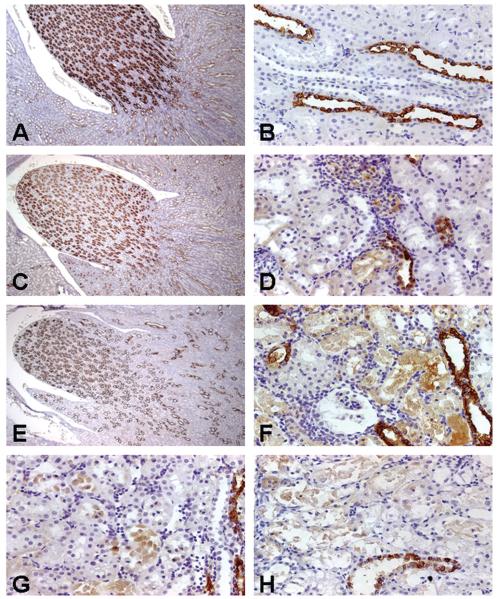
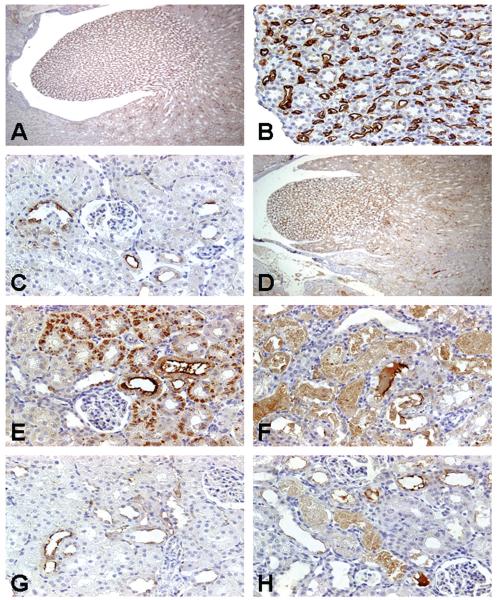
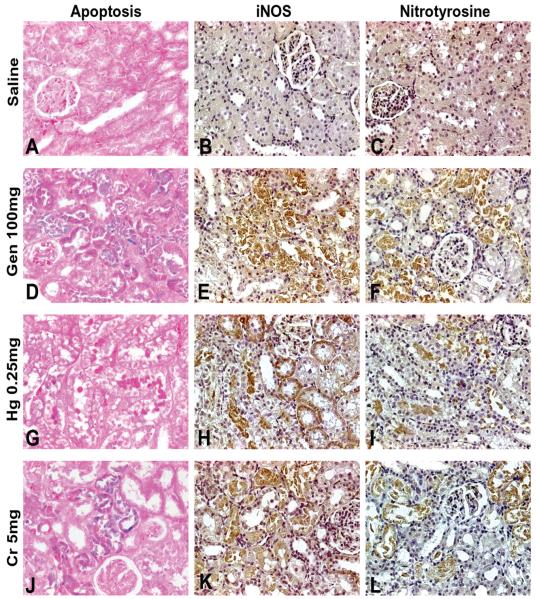
Immunohistochemical studies for kidney injury molecule-1 (Kim-1), renal papillary antigen-1 (RPA-1), and renal papillary antigen-2 (RPA-2) were conducted to explore their relationship to inducible nitric oxide synthase (iNOS) and nitrotyrosine expression. Male Sprague-Dawley rats were exposed to gentamicin (100 mg/kg/day Gen, sc, for 3 days), mercury (0.25 mg Hg/kg, iv, single dose), or chromium (5 mg Cr/kg, sc, single dose) and kidney tissue was examined 24 hours or 72 hours after the last dose of the nephrotoxicant. Another group of kidneys was evaluated 24 hours after rats were administered 3 daily doses (50, 100, 150, 200, or 300 mg/kg/day) of Gen. Gen- and Cr-treated rats exhibited increased immunoreactivity of Kim-1, RPA-1, and RPA-2 largely in the S1/S2 segments and to a lesser extent in the S3 segments of the proximal tubule of the kidney, whereas Hg-treated rats showed increased immunoreactivity of Kim-1, RPA-1, and RPA-2 in the S3 segments. Up-regulation of Kim-1, RPA-1, and RPA-2 expression correlated with injured tubular epithelial cells and also correlated with immunoreactivity of iNOS and nitrotyrosine. It is possible that iNOS activation with nitrotyrosine production in injured nephron segments may be involved in the induction of Kim-1, RPA-1, and RPA-2 following exposure to nephrotoxicants.
Figures
Comment in
-
Immunohistochemical localization of RPA-1; comment on paper by Zhang et al., Toxicol Pathol 36;397.Toxicol Pathol. 2008 Oct;36(6):890; author reply 891-3. doi: 10.1177/0192623308323625. Epub 2008 Aug 12. Toxicol Pathol. 2008. PMID: 18701423 No abstract available.
Similar articles
-
Differences in immunolocalization of Kim-1, RPA-1, and RPA-2 in kidneys of gentamicin-, cisplatin-, and valproic acid-treated rats: potential role of iNOS and nitrotyrosine.Toxicol Pathol. 2009 Aug;37(5):629-43. doi: 10.1177/0192623309339605. Epub 2009 Jun 17. Toxicol Pathol. 2009. PMID: 19535489 Free PMC article.
-
Comparison of kidney injury molecule-1 and other nephrotoxicity biomarkers in urine and kidney following acute exposure to gentamicin, mercury, and chromium.Toxicol Sci. 2008 Jan;101(1):159-70. doi: 10.1093/toxsci/kfm260. Epub 2007 Oct 13. Toxicol Sci. 2008. PMID: 17934191 Free PMC article.
-
Glutamine synthetase activity in rat urine as sensitive marker to detect S3 segment-specific injury of proximal tubule induced by xenobiotics.Arch Toxicol. 1999 Jun-Jul;73(4-5):255-62. doi: 10.1007/s002040050614. Arch Toxicol. 1999. PMID: 10463391
-
Kidney injury molecule-1: a tissue and urinary biomarker for nephrotoxicant-induced renal injury.Am J Physiol Renal Physiol. 2004 Mar;286(3):F552-63. doi: 10.1152/ajprenal.00285.2002. Epub 2003 Nov 4. Am J Physiol Renal Physiol. 2004. PMID: 14600030
-
Expression of kidney injury molecule-1 (Kim-1) in relation to necrosis and apoptosis during the early stages of Cd-induced proximal tubule injury.Toxicol Appl Pharmacol. 2009 Aug 1;238(3):306-14. doi: 10.1016/j.taap.2009.01.016. Epub 2009 Jan 31. Toxicol Appl Pharmacol. 2009. PMID: 19371613 Free PMC article.
Cited by
-
Phenothiazine Inhibitors of TLKs Affect Double-Strand Break Repair and DNA Damage Response Recovery and Potentiate Tumor Killing with Radiomimetic Therapy.Genes Cancer. 2013 Jan;4(1-2):39-53. doi: 10.1177/1947601913479020. Genes Cancer. 2013. PMID: 23946870 Free PMC article.
-
Biomarkers of mercury toxicity: Past, present, and future trends.J Toxicol Environ Health B Crit Rev. 2017;20(3):119-154. doi: 10.1080/10937404.2017.1289834. Epub 2017 Apr 5. J Toxicol Environ Health B Crit Rev. 2017. PMID: 28379072 Free PMC article. Review.
-
Aminoglycoside-induced nephrotoxicity in children.Pediatr Nephrol. 2017 Nov;32(11):2015-2025. doi: 10.1007/s00467-016-3533-z. Epub 2016 Nov 15. Pediatr Nephrol. 2017. PMID: 27848094 Free PMC article. Review.
-
Protective impact of Spirulina platensis against γ-irradiation and thioacetamide-induced nephrotoxicity in rats mediated by regulation of micro-RNA 1 and micro-RNA 146a.Toxicol Res (Camb). 2021 Apr 28;10(3):453-466. doi: 10.1093/toxres/tfab037. eCollection 2021 May. Toxicol Res (Camb). 2021. PMID: 34141159 Free PMC article.
-
Gentamicin induced acute renal damage and its evaluation using urinary biomarkers in rats.Toxicol Rep. 2018 Nov 30;6:91-99. doi: 10.1016/j.toxrep.2018.11.015. eCollection 2019. Toxicol Rep. 2018. PMID: 30581763 Free PMC article.
References
-
- Ahn KY, Mohaupt MG, Madsen KM, Kone BC. In situ hybridization localization of mRNA encoding inducible nitric oxide synthase in the rat kidney. Am J Physiol. 1994;267:F748–57. - PubMed
-
- Amin RP, Vickers AE, Sistare F, Thompson KL, Roman RJ, Lawton M, Kramer J, Hamadeh HK, Collins J, Grissom S, Bennett L, Tucker CJ, Wild S, Kind C, Oreffo V, Davis JW, II, Curtiss S, Naciff JM, Cunningham M, Tennant R, Stevens J, Car B, Bertram TA, Afshart CA. Identification of putative gene based markers of renal toxicity. Environ Health Perspect. 2004;112:465–79. - PMC - PubMed
-
- Appenroth D, Gambaryan S, Gerhardt S, Kersten L, Braunlich H. Age dependent differences in the functional and morphological impairment of kidney following cisplatin administration. Exp Pathol. 1990;38:231–9. - PubMed
-
- Bachmann S. Distribution of NOS in the kidney. In: Goligorsky MS, Gross SS, editors. Nitric Oxide and the Kidney: Physiology and Pathophysiology. Chapman and Hall; New York: 1997. pp. 133–57.
-
- Bagchi D, Bagchi M, Stohs SJ. Chromium (VI)-induced oxidative stress, apoptotic cell death and modulation of p53 tumor suppressor gene. Mol Cell Biochem. 2001;222:149–58. - PubMed
Publication types
MeSH terms
Substances
Grants and funding
LinkOut - more resources
Full Text Sources
