. 2008 Apr 25;15(5):335-47.
doi: 10.1101/lm.984508. Print 2008 May.

Proteasome inhibition enhances the induction and impairs the maintenance of late-phase long-term potentiation

Affiliations

Proteasome inhibition enhances the induction and impairs the maintenance of late-phase long-term potentiation

Chenghai Dong et al. Learn Mem. .

Abstract

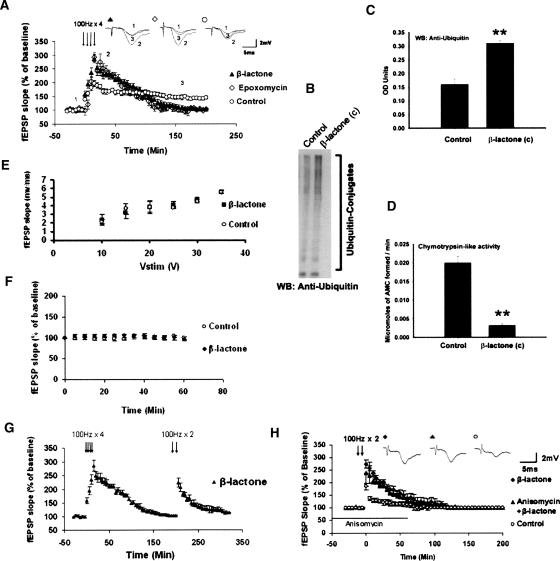
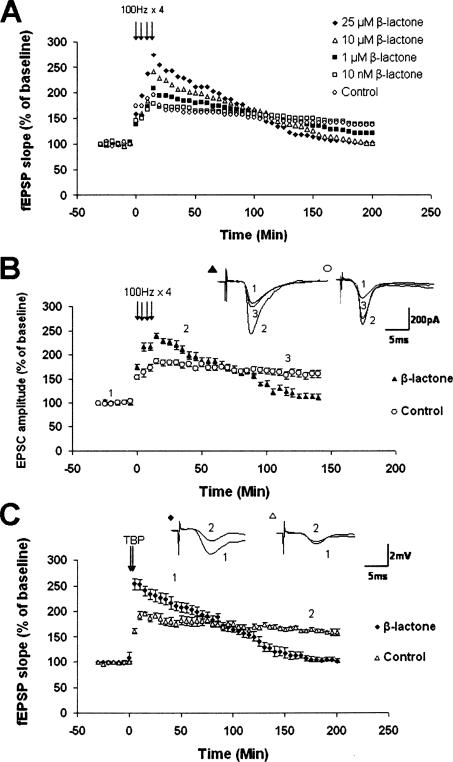
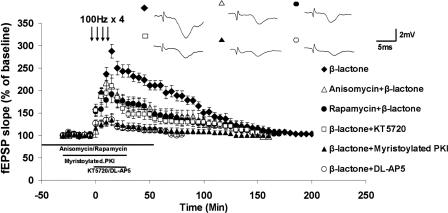
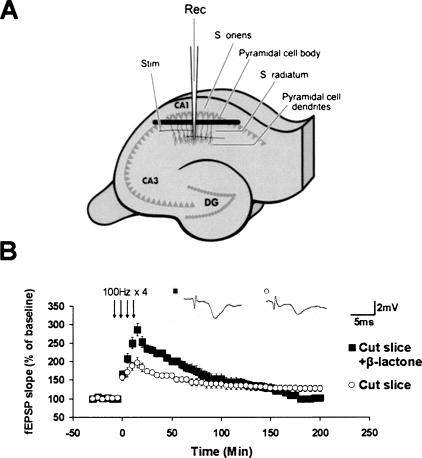
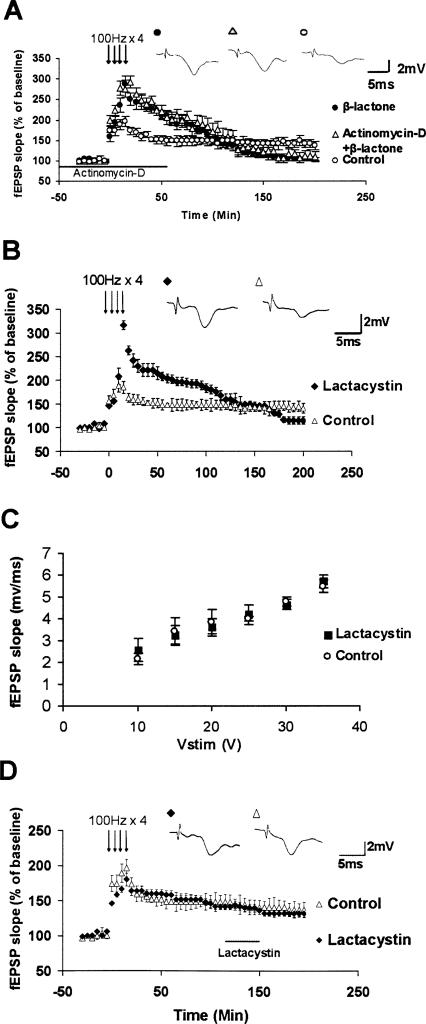
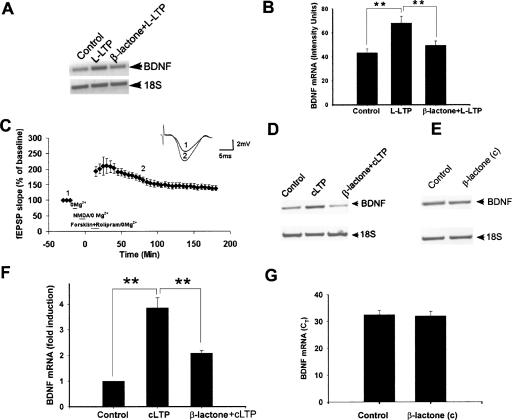
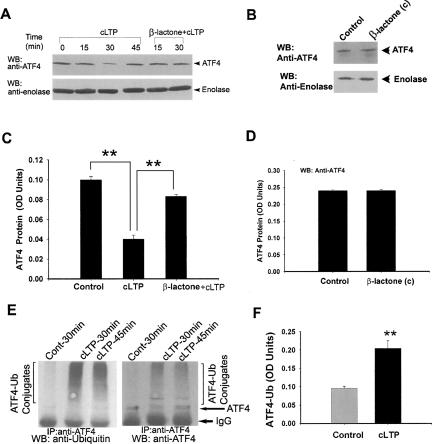
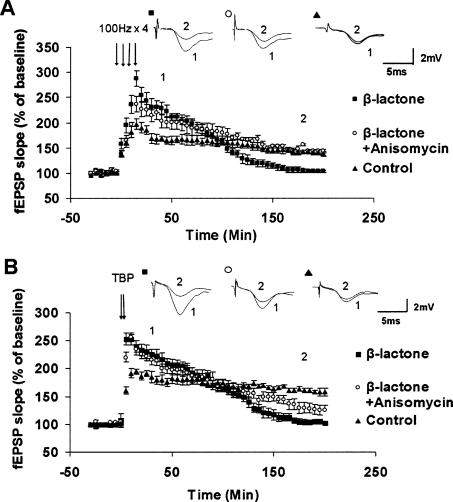
Protein degradation by the ubiquitin-proteasome pathway plays important roles in synaptic plasticity, but the molecular mechanisms by which proteolysis regulates synaptic strength are not well understood. We investigated the role of the proteasome in hippocampal late-phase long-term potentiation (L-LTP), a model for enduring synaptic plasticity. We show here that inhibition of the proteasome enhances the induction of L-LTP, but inhibits its maintenance. Proteasome inhibitor-mediated enhancement of the early part of L-LTP requires activation of NMDA receptors and the cAMP-dependent protein kinase. Augmentation of L-LTP induction by proteasome inhibition is blocked by a protein synthesis inhibitor anisomycin and is sensitive to the drug rapamycin. Our findings indicate that proteasome inhibition increases the induction of L-LTP by stabilizing locally translated proteins in dendrites. In addition, our data show that inhibition of the proteasome blocks transcription of brain-derived neurotrophic factor (BDNF), which is a cAMP-responsive element-binding protein (CREB)-inducible gene. Furthermore, our results demonstrate that the proteasome inhibitors block degradation of ATF4, a CREB repressor. Thus, proteasome inhibition appears to hinder CREB-mediated transcription. Our results indicate that blockade of proteasome activity obstructs the maintenance of L-LTP by interfering with transcription as well as translation required to sustain L-LTP. Thus, proteasome-mediated proteolysis has different roles during the induction and the maintenance of L-LTP.


Figures

Figure 1.
Figure 1.
Effect of proteasome inhibitors on L-LTP and basal synaptic transmission, and biochemical measurements of proteasome inhibition. (A) Enhancement of Ep-L-LTP with proteasome inhibitors β-lactone (▴) and epoxomycin (◊) relative to control (◦). Both proteasome inhibitors significantly increase Ep-L-LTP (P < 0.001). Between 2 and 3 h, enhancement of Ep-L-LTP begins to decay, and at 3 h is significantly less (P < 0.05) than the control L-LTP. The data were analyzed by two-way ANOVA with post-hoc Tukey test. (Inset) Representative traces taken at different time points (1 = baseline; 2 = 30 min; 3 = 180 min) for control and treatment with β-lactone and epoxomycin. (B) Proteasome inhibition in hippocampal slices treated with β-lactone [β-lactone (c)] for 30 min causes accumulation of ubiquitin conjugates of proteins. (C) Quantification of ubiquitin conjugates indicates about twofold (1.94 ± 0.10; **P < 0.01; n = 5; t-test) accumulation of ubiquitinated proteins in β-lactone (c) slices relative to untreated slices. (D) β-lactone treatment of control slices [β-lactone (c)] for 30 min causes significant decrease (92 ± 2% inhibition; **P < 0.01; n = 5; t-test) in catalytic activity of the proteasome as indicated by measurement of chymotrypsin-like activity of the proteasome. (E) Normal basal synaptic transmission in β-lactone-treated hippocampal slices (n = 11) compared with untreated control (n = 10) slices. The graph shows input–output curves of fEPSP slope (mV/ms) versus stimulus at the Schaffer collateral pathway with and without β-lactone. (F) Proteasome inhibition does not affect basal synaptic transmission, as shown by a second method. As an additional way to test the effect of proteasome inhibition on basal synaptic transmission, we continued the baseline recordings in slices pretreated with β-lactone or untreated (control) slices for 1 h. No differences under the two conditions were observed (at 30 min, control: 97 ± 2%; β-lactone: 106 ± 4%; at 60 min, control: 101 ± 5%; β-lactone: 100 ± 3%; n = 6; P = 0.183, 0.337, and 0.846 for treatment, time, and interaction, respectively; two-way ANOVA). (G) Induction of E-LTP after Ep-L-LTP decay. In the slices treated with β-lactone, E-LTP can be induced in β-lactone-treated slices (n = 3) after Ep-L-LTP decays back to baseline. These results indicate that the decay of Ep-L-LTP is not due to deterioration of slices because of β-lactone treatment. (H) Enhancement of E-LTP with β-lactone. E-LTP is enhanced (P < 0.01) in β-lactone-treated slices (◆) relative to untreated controls (◦). Prior treatment of slices with anisomycin (▴) has no significant (P = 0.700) effect on enhancement of E-LTP by β-lactone. (Inset) Representative traces taken at 30 min.
Figure 2.
Figure 2.
Additional evidence for the effect of proteasome inhibition on L-LTP. (A) Concentration-dependent effect of β-lactone on Ep-L-LTP and late part of L-LTP. We observed significant enhancement of Ep-L-LTP relative to control with 10 μM (P < 0.05) and 25 μM (P < 0.01), but not with 1 μM (P = 0.715) or 10 nM (P = 0.104). At 3 h we observed significant decrease in L-LTP with 25 μM (P < 0.001), 10 μM (P < 0.01), but not with1 μM (P = 0.208) or 10 nM (P = 0.751) β-lactone. Error bars from the graph have been removed for the sake of clarity in the illustration. (B) Enhancement in Ep-L-LTP and inhibition of late part of L-LTP with β-lactone measured by whole-cell recording of CA1 pyramidal neurons. Mean EPSCs from untreated and β-lactone-treated slices after induction of L-LTP. Extent of LTP is significantly (P < 0.001) higher at 30 min in β-lactone-treated slices compared with untreated controls. At 2 h, extent of LTP is significantly (P < 0.001) lower in β-lactone-treated slices compared with controls. (Inset) Representative EPSCs from neurons from untreated and β-lactone-treated slices (1 = baseline; 2 = 30 min; 3 = 120 min). (C) Proteasome inhibition enhances L-LTP induced by theta burst protocol (TBP). L-LTP was induced with or without pretreatment with β-lactone using TBP. Significant enhancement of Ep-L-LTP (P < 0.001) and inhibition of maintenance (P < 0.001) part of L-LTP were observed. (Inset) Representative traces taken at different time points (1 = 30 min; 2 = 180 min) for control and treatment with β-lactone.
Figure 3.
Figure 3.
Characteristics of β-lactone-enhanced Ep-L-LTP. Dependence on NMDA receptors: Inclusion of NMDA receptor antagonist DL-AP5 (n = 6) in the bath almost completely (P < 0.001) abolishes Ep-L-LTP compared with β-lactone-treatment alone. Statistical analysis was by one-way ANOVA. (Inset) Representative traces taken at 30 min. Dependence on PKA: Perfusion of the PKA inhibitor KT5720 in the bath for 30 min significantly (P < 0.001) reduces Ep-L-LTP in β-lactone-treated slices compared with β-lactone-treatment alone. Treatment of slices with myristoylated PKI also (P < 0.001) significantly decreases Ep-L-LTP. Inhibition by anisomycin: Treatment of slices with anisomycin prior to β-lactone treatment significantly (P < 0.01) diminishes the magnitude of Ep-L-LTP relative to β-lactone treatment alone. Inhibition by rapamycin: Rapamycin pretreatment also significantly (P < 0.01) reduces the β-lactone-enhanced Ep-L-LTP compared with β-lactone treatment alone.
Figure 4.
Figure 4.
Proteasome inhibition in isolated dendrites enhances Ep-L-LTP. (A) Schematic illustration of surgical isolation of dendrites. A cut (black bar) is made just below the pyramidal cell body layer in the CA1 region. Recording electrode (Rec) is placed in the dendritic layer of pyramidal cells. Position of the stimulation electrode (Stim), and the layers stratum radiatum and stratum oriens are also indicated. (DG) Dentate gyrus. (B) Treatment of slices with β-lactone significantly (P < 0.05) enhances Ep-L-LTP in dendrites relative to untreated cut slices. (Inset) Representative traces taken at 30 min for untreated cut slices and cut slices treated with β-lactone are shown.
Figure 5.
Figure 5.
Proteasome inhibition enhances Ep-L-LTP without requiring transcription, but blocks L-LTP maintenance within a time window coinciding with that of transcription. (A) Enhancement of Ep-L-LTP does not require transcription. No significant difference in augmentation of Ep-L-LTP was observed in the presence of transcription inhibitor actinomycin D (P = 0.657). (Inset) Representative traces taken at 30 min. (B) For testing the effect on L-LTP maintenance, we needed to use another proteasome inhibitor lactacystin. To ascertain that lactacystin has a similar effect on L-LTP compared with that of β-lactone, we preincubated the slices with lactacystin (25 μM) and induced L-LTP. Lactacystin also significantly (P < 0.01) enhanced Ep-L-LTP, albeit to a slightly lesser extent than β-lactone. Overall, the effect of lactacystin was the same as that of β-lactone: At 30 min, Ep-L-LTP was significantly (P < 0.01) higher compared with control L-LTP; lactacystin-enhanced Ep-L-LTP decayed between 2 and 3 h, and at 3 h was significantly less (P < 0.05) than L-LTP in control slices. (Inset) Representative traces taken at 30 min. (C) Normal basal synaptic transmission in lactacystin-treated hippocampal slices (n = 6) compared with untreated control (n = 6) slices. The graph shows input–output curves of fEPSP slope (mV/ms) versus stimulus at the Schaffer collateral pathway with and without lactacystin. (D) Application of proteasome inhibitor lactacystin 2 h after tetanization does not block the maintenance of L-LTP. (Inset) Representative traces taken at 180 min.
Figure 6.
Figure 6.
Molecular evidence for a role of the proteasome in transcription required for L-LTP. (A) L-LTP with theta-burst protocol induces BDNF mRNA and β-lactone inhibits BDNF induction. Semiquantitative RT–PCR shows induction of BDNF, a CREB-inducible gene, during L-LTP compared with control slices. Proteasome inhibitor β-lactone inhibits BDNF mRNA induction. 18S rRNA was used as control. (B) Quantification of BDNF mRNA induction and inhibition of induction by semiquantitative PCR showing significant induction of BDNF mRNA (**P < 0.01, n = 4; one-way ANOVA) with L-LTP and significant inhibition (**P < 0.01; n = 4) of BDNF mRNA induction with L-LTP after treatment with β-lactone. (C) Induction of cLTP with NMDA, forskolin, and rolipram. The figure shows induction of LTP with the cLTP protocol: Slices were treated with NMDA for 10 min, followed by forskolin + rolipram for 15 min. LTP induced is sustained up to 3 h (n = 7). (D) cLTP induces BDNF mRNA and β-lactone inhibits BDNF induction. Semiquantitative RT–PCR shows induction of BDNF, a CREB-inducible gene, during cLTP, compared with control slices. Proteasome inhibitor β-lactone inhibits BDNF mRNA induction. 18S rRNA was used as control. (E) β-lactone treatment of control slices (β-lactone (c)) has no appreciable effect on BDNF mRNA as measured by semiquantitative RT–PCR relative to untreated controls. (F) Quantification of BDNF mRNA induction and inhibition of induction by quantitative real-time PCR showing significant (**P < 0.001) induction of BDNF mRNA with cLTP and significant (**P < 0.01; n = 4; one-way ANOVA) inhibition of BDNF mRNA induction with cLTP after treatment with β-lactone. (G) Quantitative real-time PCR of BDNF mRNA shows no significant differences between control slices and control slices treated with the proteasome inhibitor [β-lactone (c)] [threshold cycle (CT) in control: 32.48 ± 1.55; CT in β-lactone (c): 31.98 ± 1.76; P = 0.620; n = 4. Also, comparison of fold induction calculated from CT does not show any differences [P = 0.112]).
Figure 7.
Figure 7.
Degradation of ATF4 during cLTP and its stabilization by proteasome inhibition. (A) Degradation of CREB repressor ATF4 during cLTP and inhibition of ATF4 degradation by β-lactone. Immunoblot experiments show degradation of ATF4 at 15 and 30 min after initiation of cLTP protocol. Degradation was inhibited when cLTP was induced after preincubation with the proteasome inhibitor β-lactone (see last two lanes at top labeled “β-lactone + cLTP”). ATF4 quantity was restored by 45 min, indicating that ATF4 degradation occurs during a narrow time window. (Bottom) The blot was stripped and reprobed with anti-enolase antibody to show equal loading of protein. (B) β-lactone treatment of control slices [β-lactone (c)] has no significant effect on ATF4 immunoreactivity. (C) Quantification of ATF4 degradation and inhibition of degradation by β-lactone. ATF4 quantity was significantly (**P < 0.001; n = 9; one-way ANOVA) diminished 30 min after initiation of cLTP protocol and the protein was significantly (**P < 0.001; n = 6; one-way ANOVA) stabilized when the cLTP protocol was carried out in the presence of β-lactone. (D) Quantification of ATF4 amounts (normalized to enolase) in untreated and β-lactone (c) slices reveals no significant difference [control: 0.24 ± 0.0025 OD units; β-lactone (c): 0.24 ± 0.0028 OD units; P = 0.537; n = 4; t-test]. (E) ATF4 ubiquitination is increased during cLTP. ATF4 was immunoprecipitated (IP) from extracts of hippocampal slices with or without cLTP treatment and the immunoprecipitated material was analyzed by Western Blot (WB) with anti-ubiquitin antibodies (left). The blot was stripped and reprobed with anti-ATF4 antibodies (right). IgG band which shows because of reactivity to the secondary antibody is indicated. The high molecular weight components show both ubiquitin and ATF4 immunoreactivity, and therefore are ATF4-ubiquitin (Ub) conjugates. The ATF4-Ub conjugates are increased in the cLTP samples at 30 min and begin to decrease at 45 min. (F) Quantification of ATF4-ubiquitin conjugates (at 30-min time point) by densitometry shows about twofold increase (2.09 ± 0.18-fold relative to controls; **P < 0.001; n = 5; t-test) in the amount of ATF4-ubiquitin conjugates in the cLTP samples.
Figure 8.
Figure 8.
Recovery of L-LTP maintenance with anisomycin treatment after proteasome inhibition. (A) L-LTP was induced with 4 × 100 Hz protocol by pretreatment with β-lactone alone or pretreatment with β-lactone followed by anisomycin treatment. Inhibition of the late part of L-LTP was prevented with β-lactone + anisomycin, and L-LTP is restored to control levels. (Inset) Representative traces taken at different time points (1 = 30 min; 2 = 180 min) for control and, treatment with β-lactone and β-lactone + anisomycin. (B) L-LTP was induced with theta burst protocol (TBP) with pretreatment with β-lactone alone or pretreatment with β-lactone followed by anisomycin treatment. Inhibition of the late part of L-LTP was prevented to some extent and the recovery was partial. (Inset) Representative traces taken at different time points (1 = 30 min; 2 = 180 min) for control and treatment with β-lactone and β-lactone + anisomycin.

References

    1. Abel T., Nguyen P.V., Barad M., Deuel T.A., Kandel E.R., Bourtchouladze R. Genetic demonstration of a role for PKA in the late phase of LTP and in hippocampus-based long-term memory. Cell. 1997;88:615–626. - PubMed
    1. Barco A., Alarcon J.M., Kandel E.R. Expression of constitutively active CREB protein facilitates the late phase of long-term potentiation by enhancing synaptic capture. Cell. 2002;108:689–703. - PubMed
    1. Barco A., Patterson S., Alarcon J.M., Gromova P., Mata-Roig M., Morozov A., Kandel E.R. Gene expression profiling of facilitated L-LTP in VP16-CREB mice reveals that BDNF is critical for the maintenance of LTP and its synaptic capture. Neuron. 2005;48:123–137. - PubMed
    1. Bland B.H. The physiology and pharmacology of hippocampal formation theta rhythms. Prog. Neurobiol. 1986;26:1–54. - PubMed
    1. Blitzer R.D., Iyengar R., Landau E.M. Postsynaptic signaling networks: Cellular cogwheels underlying long-term plasticity. Biol. Psychiatry. 2005;57:113–119. - PubMed

Publication types

MeSH terms

LinkOut - more resources