. 2008 Jun 20;283(25):17635-51.
doi: 10.1074/jbc.M800109200. Epub 2008 Apr 25.

Hyaluronan-CD44 interaction activates stem cell marker Nanog, Stat-3-mediated MDR1 gene expression, and ankyrin-regulated multidrug efflux in breast and ovarian tumor cells

Affiliations

Hyaluronan-CD44 interaction activates stem cell marker Nanog, Stat-3-mediated MDR1 gene expression, and ankyrin-regulated multidrug efflux in breast and ovarian tumor cells

Lilly Y W Bourguignon et al. J Biol Chem. .

Abstract

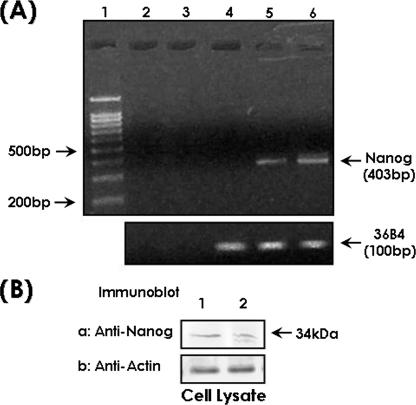
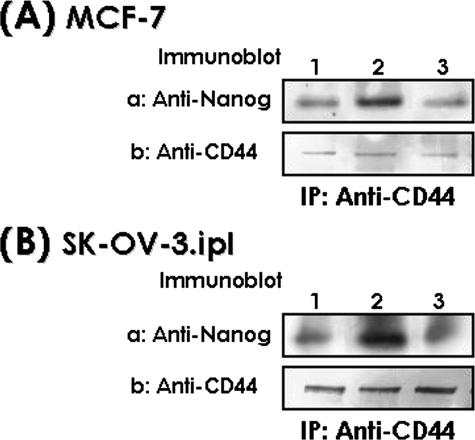
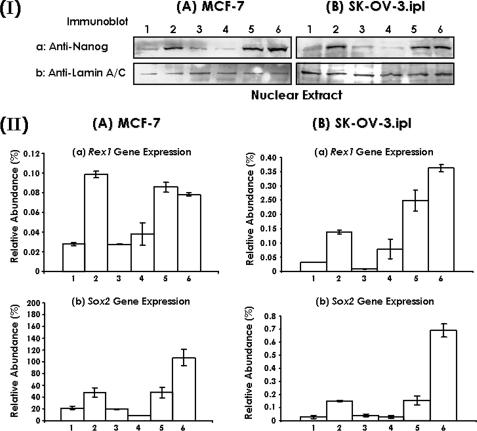
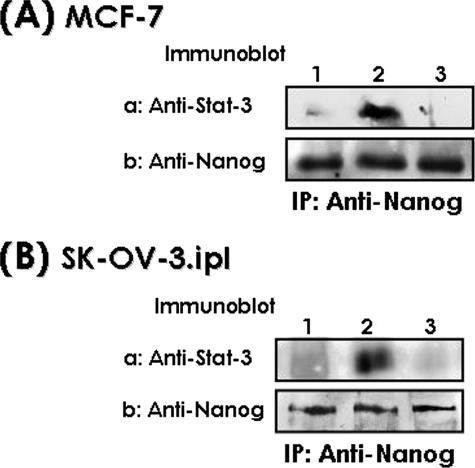
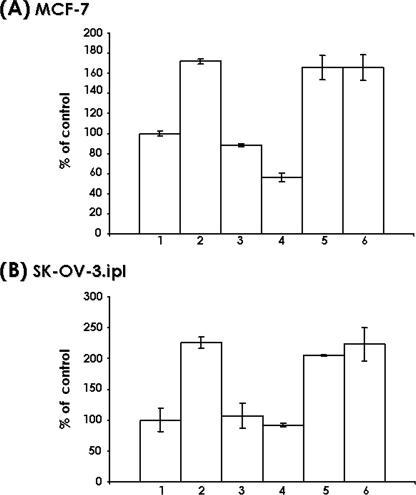
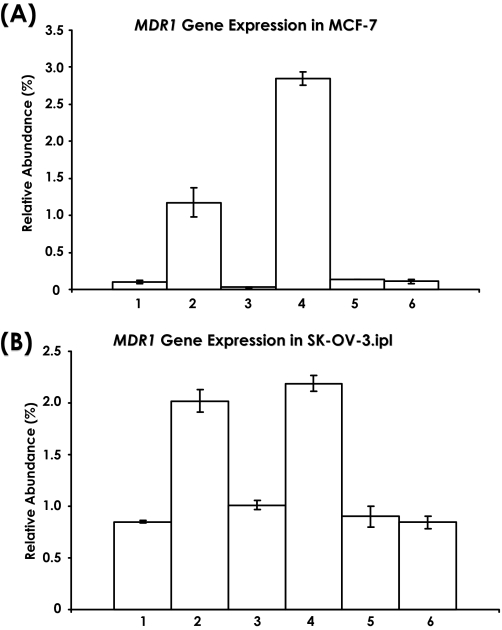
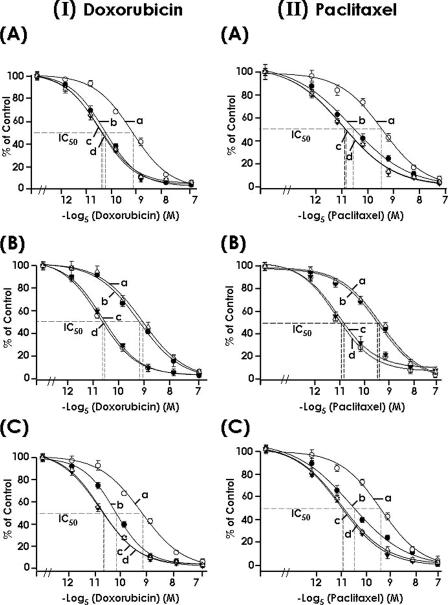
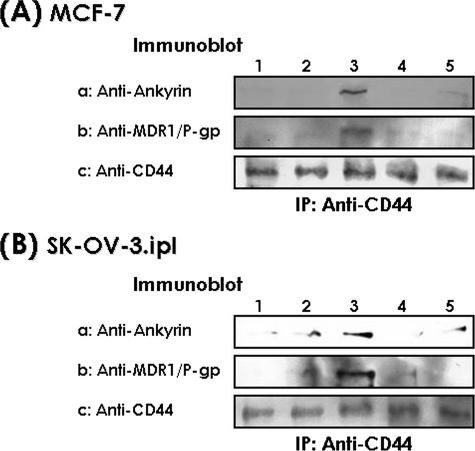
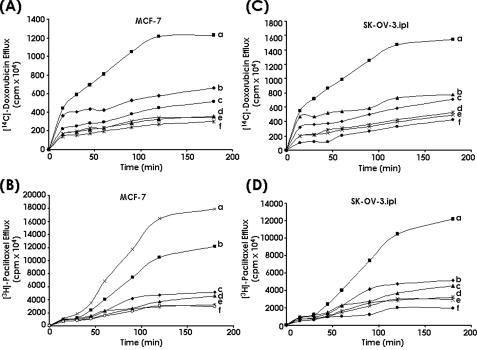
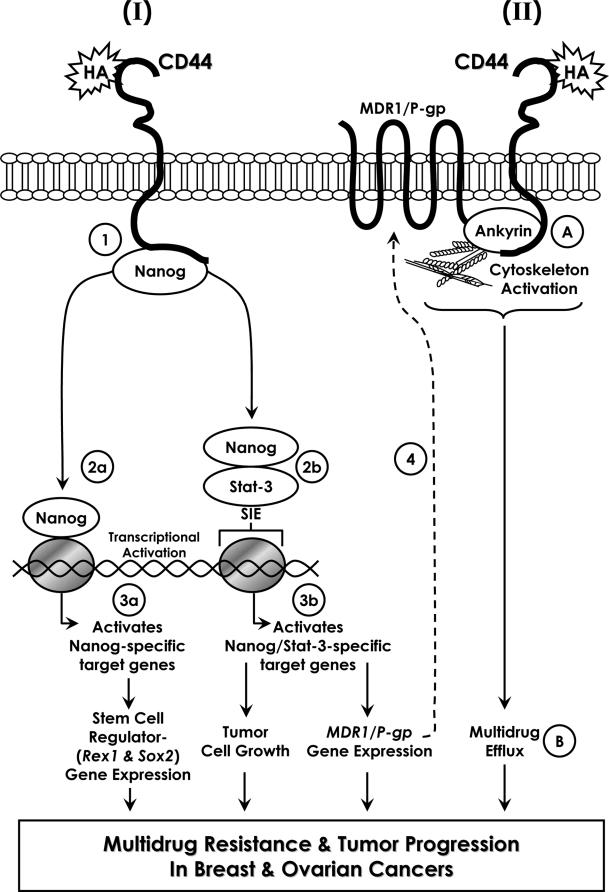
Hyaluronan (HA) is a major glycosaminoglycan in the extracellular matrix whose expression is tightly linked to multidrug resistance and tumor progression. In this study we investigated HA-induced interaction between CD44 (a HA receptor) and Nanog (an embryonic stem cell transcription factor) in both human breast tumor cells (MCF-7 cells) and human ovarian tumor cells (SK-OV-3.ipl cells). Using a specific primer pair to amplify Nanog by reverse transcriptase-PCR, we detected the expression of Nanog transcript in both tumor cell lines. In addition, our results reveal that HA binding to these tumor cells promotes Nanog protein association with CD44 followed by Nanog activation and the expression of pluripotent stem cell regulators (e.g. Rex1 and Sox2). Nanog also forms a complex with the "signal transducer and activator of transcription protein 3" (Stat-3) in the nucleus leading to Stat-3-specific transcriptional activation and multidrug transporter, MDR1 (P-glycoprotein) gene expression. Furthermore, we observed that HA-CD44 interaction induces ankyrin (a cytoskeletal protein) binding to MDR1 resulting in the efflux of chemotherapeutic drugs (e.g. doxorubicin and paclitaxel (Taxol)) and chemoresistance in these tumor cells. Overexpression of Nanog by transfecting tumor cells with Nanog cDNA stimulates Stat-3 transcriptional activation, MDR1 overexpression, and multidrug resistance. Down regulation of Nanog signaling or ankyrin function (by transfecting tumor cells with Nanog small interfering RNA or ankyrin repeat domain cDNA) not only blocks HA/CD44-mediated tumor cell behaviors but also enhances chemosensitivity. Taken together, these findings suggest that targeting HA/CD44-mediated Nanog-Stat-3 signaling pathways and ankyrin/cytoskeleton function may represent a novel approach to overcome chemotherapy resistance in some breast and ovarian tumor cells displaying stem cell marker properties during tumor progression.


Figures

FIGURE 1.
FIGURE 1.
Detection of Nanog expression in tumor cells. A, RT-PCR analysis of Nanog mRNA. Total RNA isolated from various cell types was reverse-transcribed and subjected to PCR using Nanog-specific primer pairs as described under “Materials and Methods.” DNA markers (lane 1); RT-PCR product of Nanog detected in MCF-7 cells (lane 2) or SK-OV-3.ipl cells (lane 3) in the absence of reverse transcriptase; RT-PCR product of Nanog detected in normal skin fibroblasts (lane 4) or MCF-7 cells (lane 5) or SK-OV-3.ipl cells (lane 6) in the presence of reverse transcriptase. RT-PCR product of 36B4 detected in samples used in lanes 4-6 in the presence of reverse transcriptase (as a loading control). B, detection of Nanog by anti-Nanog immunoblot analysis. Cell lysates isolated from MCF-7 or SK-OV-3.ipl cells were solubilized by 1% Non-idet P-40 buffer followed by immunoblotting with rabbit anti-Nanog antibody or anti-actin as described under “Materials and Methods.” Immunoblot of cell lysates isolated from MCF-7 cells (lane 1) or SK-OV-3.ipl cells (lane 2) with anti-Nanog antibody (panel a) and anti-actin (panel b) as a loading control.
FIGURE 2.
FIGURE 2.
Analysis of HA-mediated CD44-Nanog complex in MCF-7 cells (A) and SK-OV-3.ipl cells (B). A, cell lysates isolated from MCF-7 cells (untreated (lane 1) or treated with HA (50 μg/ml) for 5 min (lane 2) or pretreated with anti-CD44 antibody (10 μg/ml) for 1 h followed by 5 min of HA (50 μg/ml) treatment (lane 3)) were immunoprecipitated (IP) with anti-CD44 antibody followed by immunoblotting with anti-Nanog antibody (panel a) or reblotted with anti-CD44 antibody (panel b) (as a loading control). B, cell lysates isolated from SK-OV-3.ipl cells (untreated (lane 1) or treated with HA (50μg/ml) for 5 min (lane 2) or pretreated with anti-CD44 antibody (10μg/ml) for 1 h followed by 5 min of HA (50 μg/ml) treatment (lane 3)) were immunoprecipitated with anti-CD44 antibody followed by immunoblotting with anti-Nanog antibody (panel a) or reblotted with anti-CD44 antibody (panel b) (as a loading control).
FIGURE 3.
FIGURE 3.
Detection of HA-mediated Nanog nuclear localization in MCF-7 and SK-OV-3.ipl cells. I, nuclear fraction isolated from MCF-7 (I, panel A) or SK-OV-3.ipl cells (I, panel B) (untreated (lane 1) or treated with HA (50 μg/ml) for 30 min (lane 2) or pretreated with anti-CD44 for 1 h followed by 30 min of HA (50 μg/ml) treatment (lane 3) or pretreated with NanogsiRNA followed by 30 min of HA treatment (lane 4) or pretreated with scrambled sequence siRNA followed by 30 min of HA treatment (lane 5) or transfected with NanogcDNA (lane 6)) were immunoblotted with anti-Nanog antibody (a) or anti-lamin A/C antibody (b) (as a loading control). II, detection of Nanog target gene expression in both MCF-7 (panel A) and SK-OV-3.ipl cells (panel B). The expression of Nanog target genes (e.g. Rex1 and Sox2) was measured using specific primers and Q-PCR in tumor cells according to the procedures described under “Materials and Methods.” Total RNA isolated from either MCF-7 (panel A) or SK-OV-3.ipl cells (panel B) (untreated (lane 1) or treated with HA (50 μg/ml) for 24 h (lane 2) or pretreated with anti-CD44 for 1 h followed by 24 h HA (50μg/ml) treatment (lane 3) or pretreated with NanogsiRNA followed by 24 h HA treatment (lane 4) or pretreated with scrambled sequence siRNA followed by 24 h HA treatment (lane 5) or transfected with NanogcDNA (lane 6)) was reverse-transcribed and subjected to Q-PCR using Rex1 (panel A, a and panel B, a)-specific or Sox2 (panel A, b and panel B, b)-specific primer pairs as described under “Materials and Methods.” Relative mRNA expression levels of Rex1 or Sox2 in various treatments were calculated after normalization with 36B4 mRNA levels as determined by Q-PCR. The values expressed in this figure represent an average of triplicate determinations of three experiments with a standard deviation less than ±5%.
FIGURE 4.
FIGURE 4.
Analysis of HA-mediated Nanog-Stat-3 complex formation in the nuclear fraction of MCF-7 cells (A) and SK-OV-3.ipl cells (B). A, nuclear fraction isolated from MCF-7 cells (untreated (lane 1) or treated with HA (50 μg/ml) for 30 min (lane 2) or pretreated with anti-CD44 antibody (10 μg/ml) for 1 h followed by 30 min of HA (50 μg/ml) incubation (lane 3)) were immunoprecipitated (IP) with anti-Nanog antibody followed by immunoblotting with anti-Stat-3 antibody (panel a) or reblotted with anti-Nanog antibody (panel b) (as a loading control). B, nuclear fraction isolated from SK-OV-3.ipl cells (untreated (lane 1) or treated with HA (50 μg/ml) for 30 min (lane 2) or pretreated with anti-CD44 antibody (10 μg/ml) for 1 h followed by 30 min HA (50 μg/ml) incubation (lane 3)) were immunoprecipitated with anti-Nanog antibody followed by immunoblotting with anti-Stat-3 antibody (panel a) or reblotted with anti-Nanog antibody (panel b) (as a loading control).
FIGURE 5.
FIGURE 5.
Detection of Stat-3-specific transcriptional activity in tumor cells. Specifically, MCF-7 cells (A) or SK-OV-3.ipl cells (B) (untreated (lane 1) or treated with HA (50 μg/ml) for 24 h (lane 2) or pretreated with anti-CD44 for 1 h followed by 24 h of HA (50 μg/ml) treatment (lane 3) or pretreated with NanogsiRNA followed by 24 h of HA treatment (lane 4) or pretreated with scrambled sequence siRNA followed by 24 h of HA treatment (lane 5) or transfected with NanogcDNA (lane 6)) were co-transfected with pGL3SIE (luciferase reporter vector) in the presence or absence of HA (or anti-CD44 antibody plus HA) and a plasmid encoding β-galactosidase (to enable normalization for transfection efficiency). After 24 h, expression of the reporter (luciferase) and the control (β-galactosidase) genes were determined using enzyme assays and luminometry as described under “Materials and Methods.” The values expressed in this figure represent an average of triplicate determinations of 3-5 experiments with an S.D. of less than ±5%.
FIGURE 6.
FIGURE 6.
Detection of MDR1 gene expression in both MCF-7 (A) and SK-OV-3.ipl cells (B). The expression of MDR1 was measured using specific primers and Q-PCR in tumor cells according to the procedures described under “Materials and Methods.” Total RNA isolated from either MCF-7 (A) or SK-OV-3.ipl cells (B) (untreated (lane 1) or treated with HA (50μg/ml) for 24 h (lane 2) or pretreated with anti-CD44 for 1 h followed by 24 h of HA (50 μg/ml) treatment (lane 3) or transfected with NanogcDNA (lane 4) or pretreated with NanogsiRNA followed by 24 h of HA treatment (lane 5) or pretreated with Stat-3siRNA followed by 24 h of HA treatment (lane 6)) was reverse-transcribed and subjected to Q-PCR using MDR1-specific primer pairs as described under “Materials and Methods.” Relative mRNA expression levels of MDR1 in various treatments were calculated after normalization with 36B4 mRNA levels as determined by Q-PCR. The values expressed in this figure represent an average of triplicate determinations of three experiments with an S.D. of less than ±5%.
FIGURE 7.
FIGURE 7.
IC50 analyses of doxorubicin (I) and paclitaxel (II) in MCF-7 cells. MCF-7 cells (untransfected or transfected with NanogcDNA or ARDcDNA or vector alone or NanogsiRNA, Stat-3siRNA, or siRNA with scrambled sequences) (5 × 10³ cells/well) were treated with various concentrations of doxorubicin (4 × 10⁻⁹ to 1.75 × 10⁻⁵ m) (panel A) or paclitaxel (3.2 × 10⁻⁹ to 1 × 10⁻⁵ m) (panel B) with no HA or with HA (50 μg/ml) or anti-CD44 plus HA. After 24 h of incubation at 37 °C, MTT-based growth assays were analyzed as described under “Materials and Methods.” The percentage of absorbance relative to untreated controls (cells treated with neither HA nor chemotherapeutic drugs) was plotted as a linear function of drug concentration. The 50% inhibitory concentration (IC50) was identified as a concentration of drug required to achieve a 50% growth inhibition relative to untreated controls. I, panel A, a-d, MCF-7 cells (untreated (b) or treated with HA (50 μg/ml) for 24 h (a) or pretreated with anti-CD44 for 1 h followed by no HA treatment (c) or with 24 h of HA treatment (d)) were incubated with various concentrations of doxorubicin (4 × 10⁻⁹ to 1.75 × 10⁻⁵ m). I, panel B, a-d, MCF-7 cells (transfected with NanogcDNA (a) or treated with scrambled sequence siRNA plus 24 h of HA (50 μg/ml) treatment (b) or treated with NanogsiRNA plus 24 h of HA treatment (c) or Stat-3siRNA plus 24 h of HA treatment (d)) were incubated with various concentrations of doxorubicin (4 × 10⁻⁹ to 1.75 × 10⁻⁵ m). I, panel C, a-d, MCF-7 cells (transfected with vector alone plus 24 h of HA (50 μg/ml) treatment (a) or no HA (b) or transfected with ARDcDNA with no HA (c) or with 24 h of HA treatment (d)) were incubated with various concentrations of doxorubicin (4 × 10⁻⁹ to 1.75 × 10⁻⁵ m). II, panel A, a-d, MCF-7 cells (untreated (b) or treated with HA (50 μg/ml) for 24 h (a) or pretreated with anti-CD44 for 1 h followed by no HA treatment (c) or with 24 h of HA treatment (d)) were incubated with various concentrations of paclitaxel (3.2 × 10⁻⁹ to 1 × 10⁻⁵ m). II, panel B, a-d, MCF-7 cells (transfected with NanogcDNA (a) or treated with scrambled sequence siRNA plus 24 h of HA (50 μg/ml) treatment (b) or treated with NanogsiRNA plus 24 h of HA treatment (c) or Stat-3siRNA plus 24 h HA of treatment (d)) were incubated with various concentrations of paclitaxel (3.2 × 10⁻⁹ to 1 × 10⁻⁵ m). II, panel C, a-d, MCF-7 cells (transfected with vector alone plus 24 h HA (50 μg/ml) treatment (a) or no HA (b) or transfected with ARDcDNA with no HA (c) or with 24 h HA treatment (d)) were incubated with various concentrations of paclitaxel (3.2 × 10⁻⁹ to 1 × 10⁻⁵ m).
FIGURE 8.
FIGURE 8.
Analysis of HA-mediated CD44 interaction with ankyrin and MDR1 (P-gp) in MCF-7 cells (A) and SK-OV-3.ipl cells (B). Cell lysates isolated from MCF-7 cells (A) or SK-OV-3.ipl cells (B) (untreated (lane 1) or pretreated with anti-CD44 antibody (10 μg/ml) for 1 h followed by 5 min of HA (50 μg/ml) treatment (lane 2) or treated with HA (50 μg/ml) for 5 min (lane 3) or transfected with ARDcRNA with no HA (lane 4) or transfected with ARDcDNA with 5 min of HA treatment (lane 5)) were immunoprecipitated (IP) with anti-CD44 antibody followed by immunoblotting with anti-ankyrin antibody (a), or anti-MDR1 (P-gp) antibody (b), or reblotted with anti-CD44 antibody (c) (as a loading control).
FIGURE 9.
FIGURE 9.
Measurement of the drug efflux activities in MCF-7 cells (A and B) and SK-OV-3.ipl cells (C and D). For analyzing the kinetics of drug efflux, tumor cells (transfected with ARDcDNA or vector alone) treated with either [14C]doxorubicin or [3H]paclitaxel for 24 h were washed and incubated with drug-free medium containing HA (50 μg/ml) or no HA or anti-CD44 antibody plus HA or PH20-treated HA. Subsequently, aliquots (100 μl) of medium were removed at various time intervals (0, 20, 40, 60, 90, 120, and 180 min). The efflux activities of [14C]doxorubicin or [3H]paclitaxel in MCF-7 cells (A and B) or SK-OV-3.ipl cells (C and D) were measured according to the procedures described under “Materials and Methods.” A, efflux activities of [14C]doxorubicin in MCF-7 cells (transfected with vector plus HA (a) or no HA (b), or pretreated with anti-CD44 antibody plus HA (c), or transfected with ARDcDNA plus HA (d), or PH20-treated HA (e), or no HA (f)). B, efflux activities of [3H]paclitaxel in MCF-7 cells (transfected with vector plus HA (a) or no HA (b) or pretreated with anti-CD44 antibody plus HA (c), or transfected with ARDcDNA plus HA (d), or PH20-treated HA (e), or no HA (f)). C, efflux activities of [14C]doxorubicin in SK-OV-3.ipl cells (transfected with vector plus HA (a) or no HA (b) or pretreated with anti-CD44 antibody plus HA (c), or transfected with ARDcDNA plus HA (d), or no HA (e), or PH-20-treated HA (f)). D, efflux activities of [3H]paclitaxel in SK-OV-3.ipl cells (transfected with vector plus HA (a) or no HA (b) or pretreated with anti-CD44 antibody plus HA (c), or transfected with ARDcDNA plus HA (d), or no HA (e), or PH20-treated HA (f)).
FIGURE 10.
FIGURE 10.
A proposed model for CD44 interaction with Nanog signaling (I) and ankyrin (II) during HA-activated multidrug resistance and tumor progression. I, upon binding of HA, CD44 is first tightly coupled with Nanog in a complex (step 1) followed by an increase of Nanog in the nucleus. Nanog then causes transcriptional activation (step 2a) and the expression of its target genes such as Rex1 and Sox2 (step 3a). Some Nanog also forms a complex with Stat-3 in the nucleus and induces Stat-3-specific transcriptional activation (step 2b) leading to tumor cell growth and MDR-1 gene expression (step 3b) (and localization at the plasma membrane) (step 4); II, HA binding also promotes ankyrin-MDR1 (P-gp) association with CD44 (step A). This complex formation results in an efflux of chemotherapeutic drugs (step B). The coordinated HA-mediated CD44 activation of Nanog/Nanog-Stat-3 signaling (I) and the ankyrin-based cytoskeleton (II) is proposed as a possible mechanism underlying various tumor stem cell-specific behaviors, including transcriptional activation, tumor cell growth, and multidrug resistance during both breast and ovarian tumor progression.

Similar articles

Cited by

References

    1. Harnett, P. R., Kirsten, F., and Tattersall, M. H. (1986) J. Clin. Oncol. 4 952-957 - PubMed
    1. Mollinedo, F. (2005) IDrugs 8 127-143 - PubMed
    1. Hehlgans, S., Haase, M., and Cordes, N. (2007) Biochim. Biophys. Acta 1775 163-180 - PubMed
    1. Nishio, K., and Saijo, N. (1999) Anticancer Drug Des. 14 133-141 - PubMed
    1. Laurent, T. C., and Fraser, J. R. E. (1992) FASEB J. 6 2397-2404 - PubMed

Publication types

MeSH terms