

Incorporating a vascular term into a reference region model for the analysis of DCE-MRI data: a simulation study
- PMID: 18441417
- PMCID: PMC4401086
- DOI: 10.1088/0031-9155/53/10/012
Incorporating a vascular term into a reference region model for the analysis of DCE-MRI data: a simulation study
Abstract
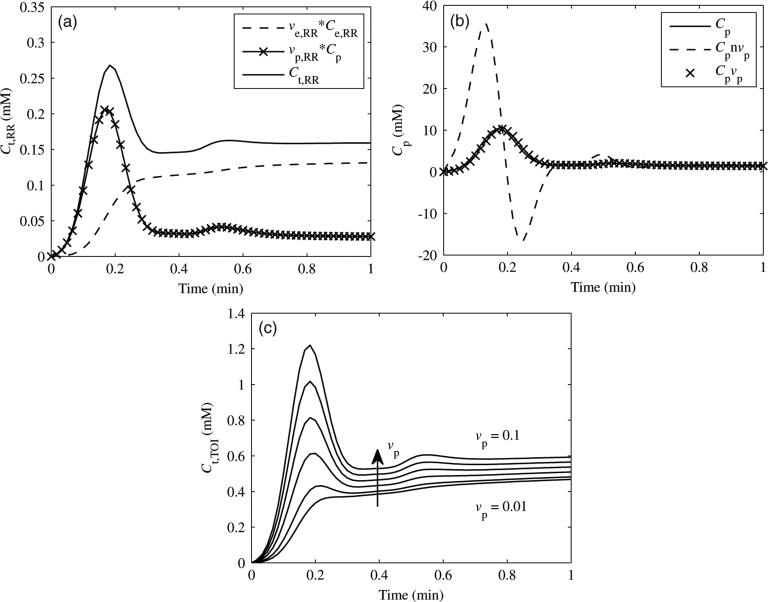
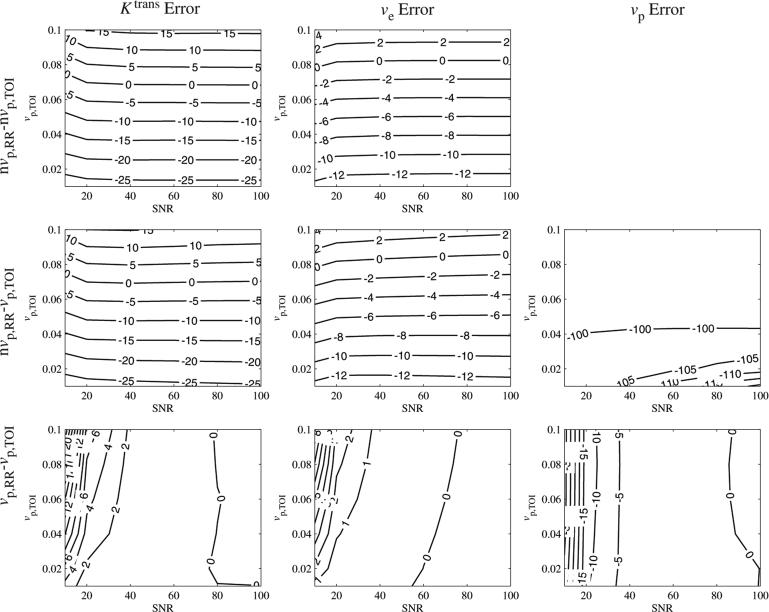
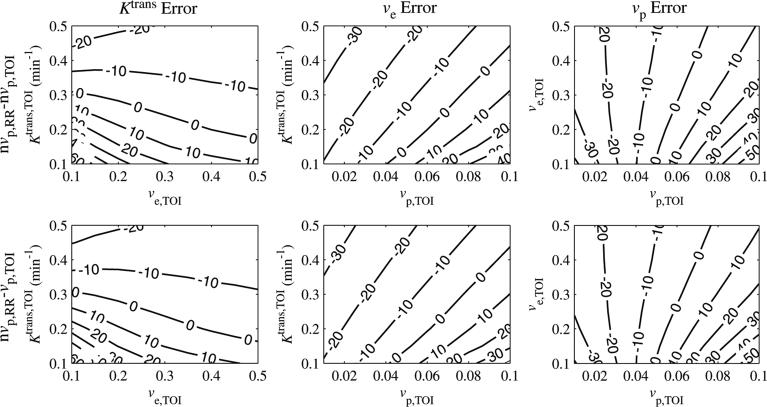
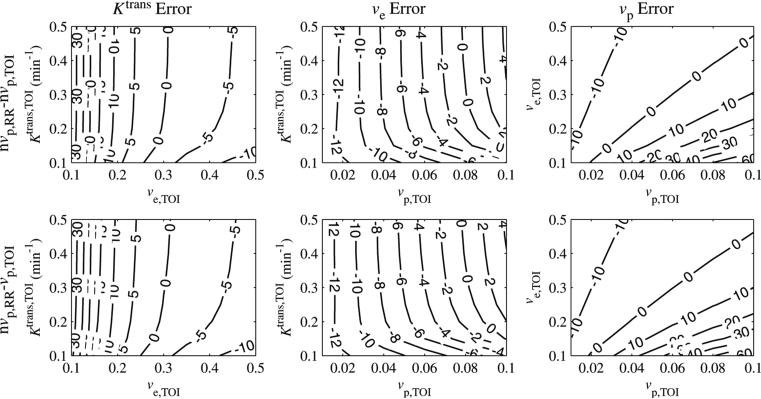
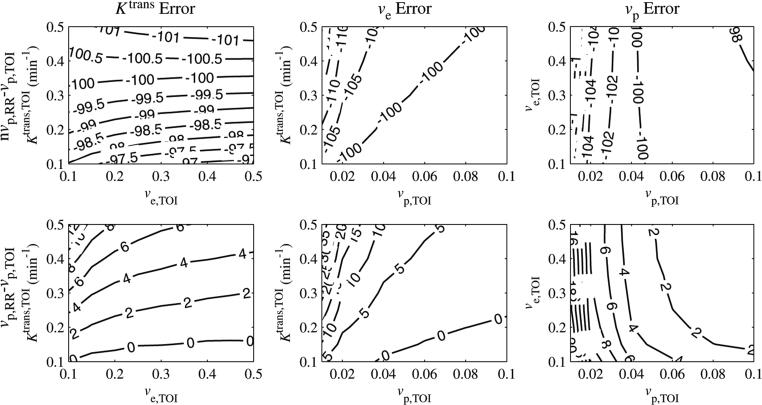
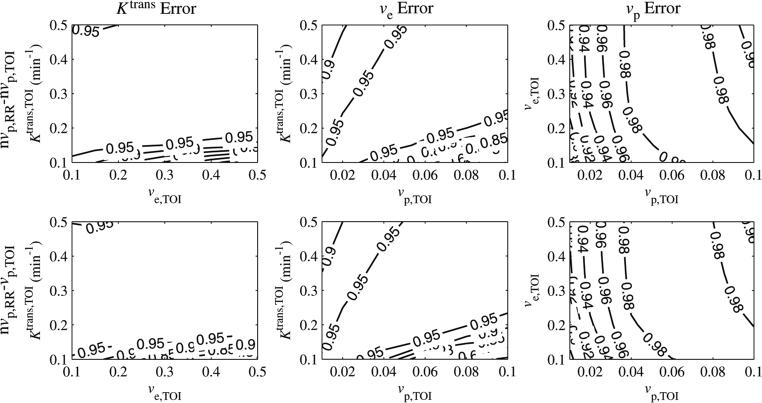
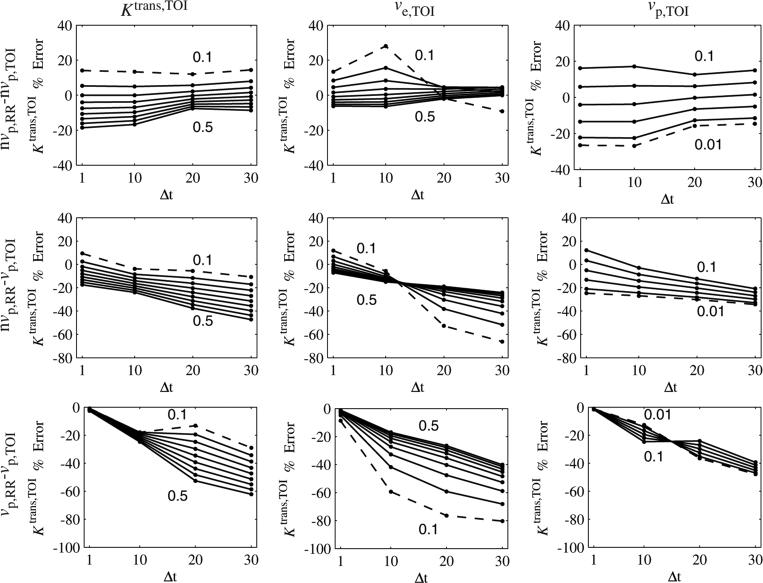
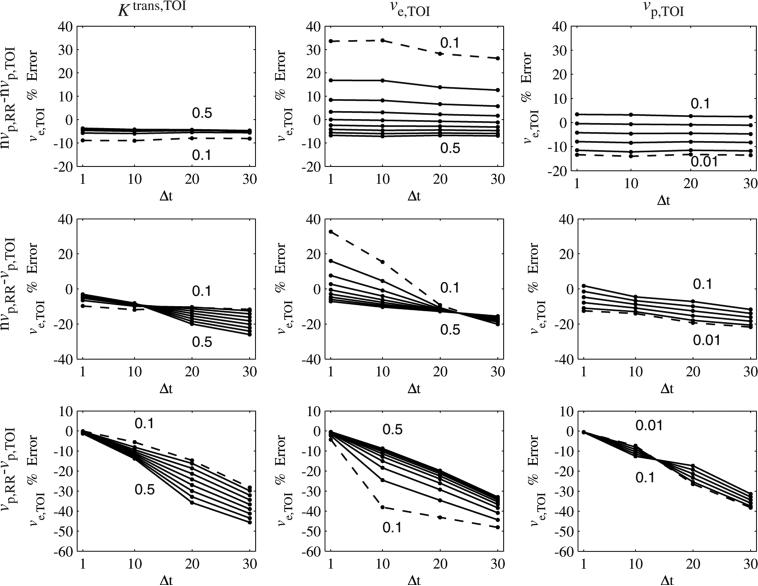
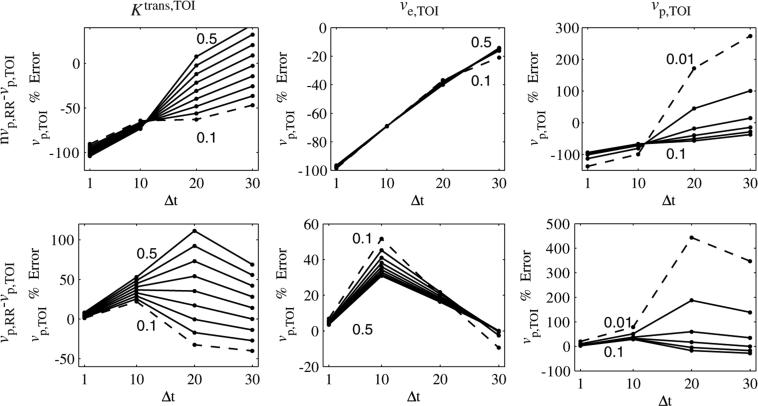
A vascular term was incorporated into a reference region (RR) model analysis of DCE-MRI data, and its effect on the accuracy of the model in estimating tissue kinetic parameters in a tissue of interest (TOI) was systematically investigated through computer simulations. Errors in the TOI volume transfer constant (K(trans,TOI)) and TOI extravascular extracellular volume (v(e,TOI)) that result when the fractional plasma volume (v(p)) was included in (1) neither region, (2) TOI only (3) both regions were investigated. For nominal values of tumor kinetic parameters (v(e,TOI) = 0.40 and K(trans,TOI) = 0.25 min(-1)), if the vascular term was included in neither region or the TOI only, K(trans,TOI) error was within 20% for 0.03 < v(p,TOI) < 0.10, and v(e,TOI) error was within 20% for the range of v(p,TOI) studied (0.01-0.10). The effects of temporal resolution were shown to be complex, and in some cases errors increased with increasing temporal resolution.
Figures
Similar articles
-
An analysis of the pharmacokinetic parameter ratios in DCE-MRI using the reference region model.Magn Reson Imaging. 2012 Jan;30(1):26-35. doi: 10.1016/j.mri.2011.09.005. Epub 2011 Nov 8. Magn Reson Imaging. 2012. PMID: 22071409
-
Quantitative pharmacokinetic analysis of DCE-MRI data without an arterial input function: a reference region model.Magn Reson Imaging. 2005 May;23(4):519-29. doi: 10.1016/j.mri.2005.02.013. Magn Reson Imaging. 2005. PMID: 15919597
-
Quantification of DCE-MRI: pharmacokinetic parameter ratio between TOI and RR in reference region model.Annu Int Conf IEEE Eng Med Biol Soc. 2010;2010:2837-40. doi: 10.1109/IEMBS.2010.5626074. Annu Int Conf IEEE Eng Med Biol Soc. 2010. PMID: 21095706
-
Comparison of analytical and numerical analysis of the reference region model for DCE-MRI.Magn Reson Imaging. 2014 Sep;32(7):845-53. doi: 10.1016/j.mri.2014.04.007. Epub 2014 Apr 24. Magn Reson Imaging. 2014. PMID: 24925838
-
Classic models for dynamic contrast-enhanced MRI.NMR Biomed. 2013 Aug;26(8):1004-27. doi: 10.1002/nbm.2940. Epub 2013 May 15. NMR Biomed. 2013. PMID: 23674304 Review.
Cited by
-
A role for dynamic contrast-enhanced magnetic resonance imaging in predicting tumour radiation response.Br J Cancer. 2016 May 24;114(11):1206-11. doi: 10.1038/bjc.2016.110. Epub 2016 May 3. Br J Cancer. 2016. PMID: 27140315 Free PMC article.
-
High-field small animal magnetic resonance oncology studies.Phys Med Biol. 2014 Jan 20;59(2):R65-R127. doi: 10.1088/0031-9155/59/2/R65. Epub 2013 Dec 30. Phys Med Biol. 2014. PMID: 24374985 Free PMC article. Review.
-
Temporal sampling requirements for reference region modeling of DCE-MRI data in human breast cancer.J Magn Reson Imaging. 2009 Jul;30(1):121-34. doi: 10.1002/jmri.21812. J Magn Reson Imaging. 2009. PMID: 19557727 Free PMC article.
-
Distribution of Intravascular and Extravascular Extracellular Volume Fractions by Total Area under Curve for Neovascularization Assessment by Dynamic Contrast-Enhanced Magnetic Resonance Imaging.J Med Signals Sens. 2014 Jul;4(3):159-70. J Med Signals Sens. 2014. PMID: 25298925 Free PMC article.
-
Tumor physiological changes during hypofractionated stereotactic body radiation therapy assessed using multi-parametric magnetic resonance imaging.Oncotarget. 2017 Jun 6;8(23):37464-37477. doi: 10.18632/oncotarget.16395. Oncotarget. 2017. PMID: 28415581 Free PMC article.
References
-
- Buckley DL. Uncertainty in the analysis of tracer kinetics using dynamic contrast-enhanced T1-weighted MRI. Magn. Reson. Med. 2002;47:601–6. - PubMed
-
- Cha S, Johnson G, Wadghiri YZ, Jin O, Babb J, Zagzag D, Turnbull DH. Dynamic, contrast-enhanced perfusion MRI in mouse gliomas: correlation with histopathology. Magn. Reson. Med. 2003;49:848–55. - PubMed
-
- Chen W, Giger ML, Bick U, Newstead GM. Automatic identification and classification of characteristic kinetic curves of breast lesions on DCE-MRI. Med. Phys. 2006;33:2878–87. - PubMed
-
- Eliat PP-AD. Magnetic resonance imaging contrast-enhanced relaxometry of breast tumors: an MRI multicenter investigation concerning 100 patients. Magn. Reson. Imaging. 2004;22:475–81. - PubMed
-
- Evelhoch JL. Key factors in the acquisition of contrast kinetic data for oncology. J. Magn. Reson. Imaging. 1999;10:254–9. - PubMed
Publication types
MeSH terms
Substances
Grants and funding
LinkOut - more resources
Full Text Sources
Medical
Miscellaneous