. 2008 Apr 28:9:218.
doi: 10.1186/1471-2105-9-218.

An efficient visualization tool for the analysis of protein mutation matrices

Affiliations

An efficient visualization tool for the analysis of protein mutation matrices

Maria Pamela C David et al. BMC Bioinformatics. .

Abstract

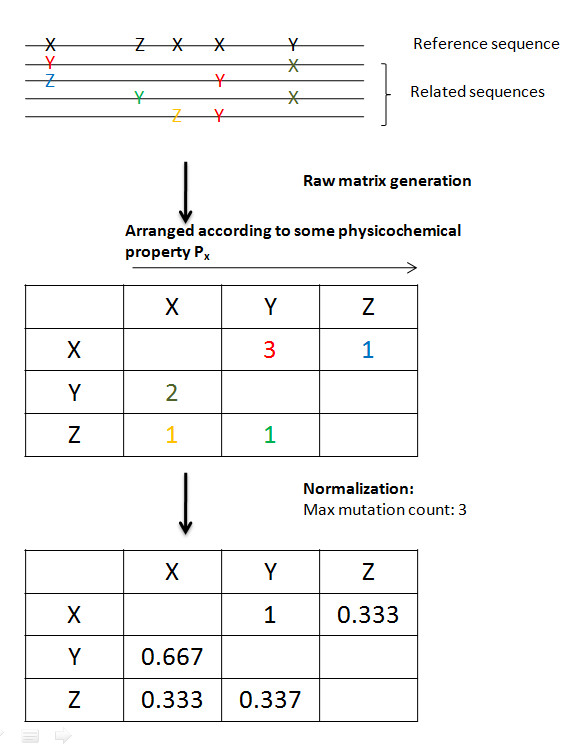
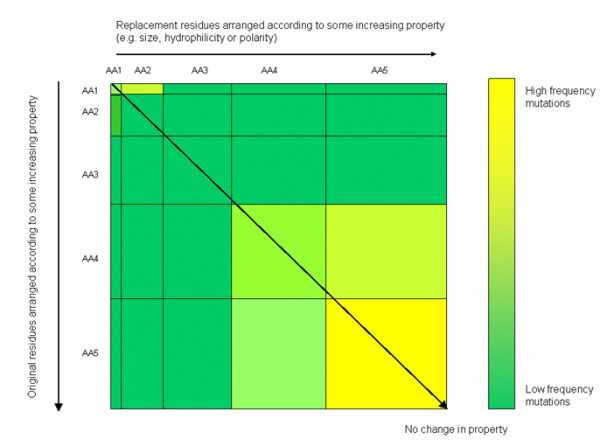
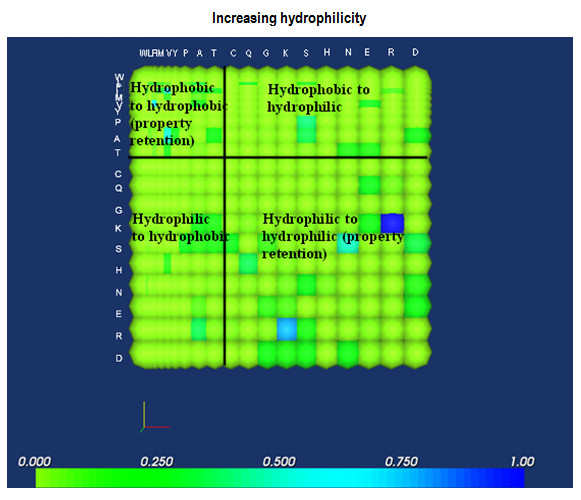
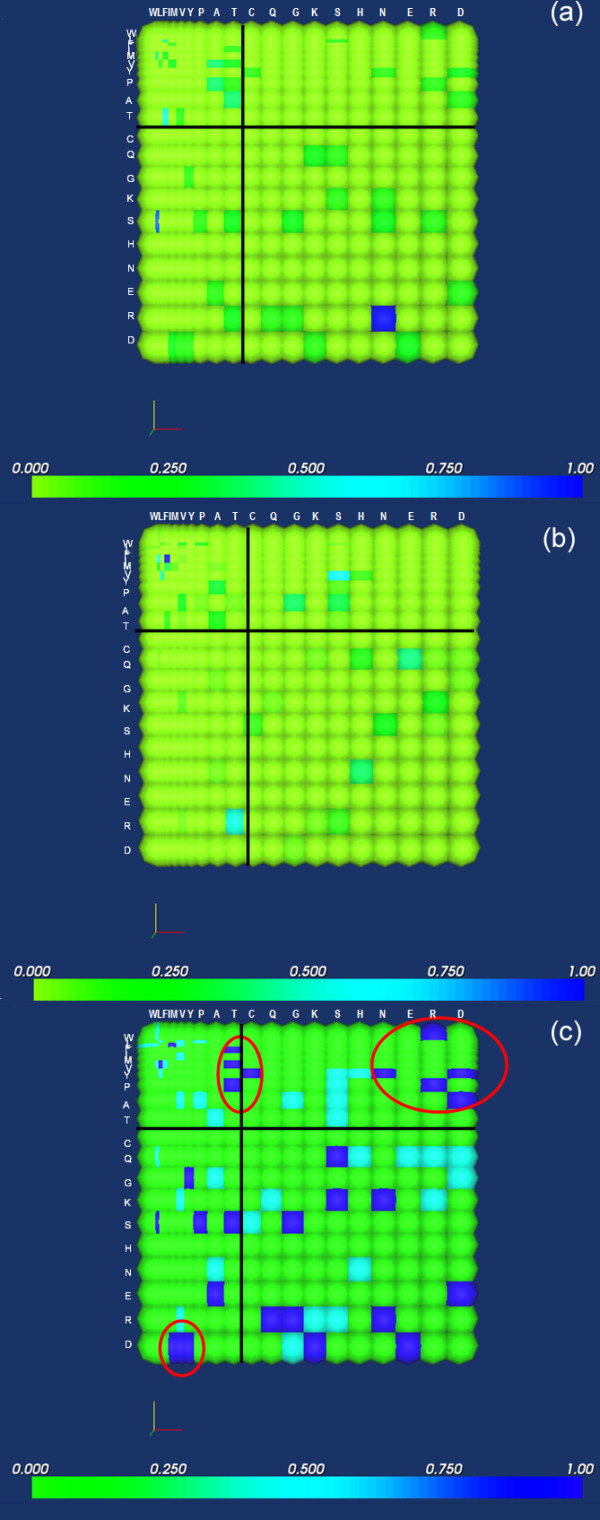
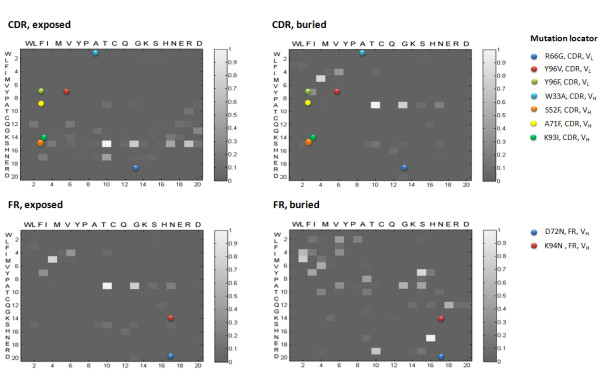
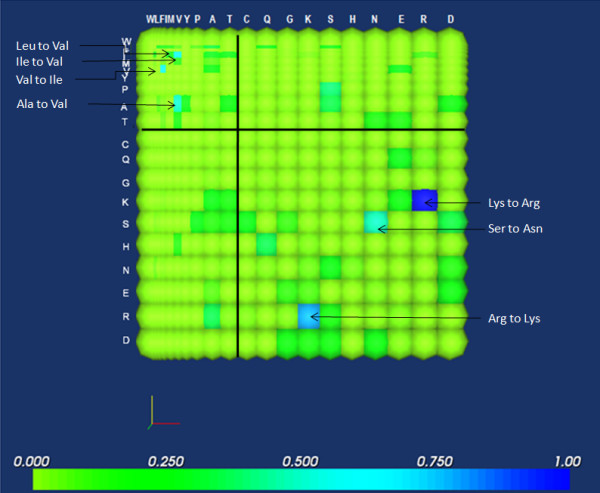
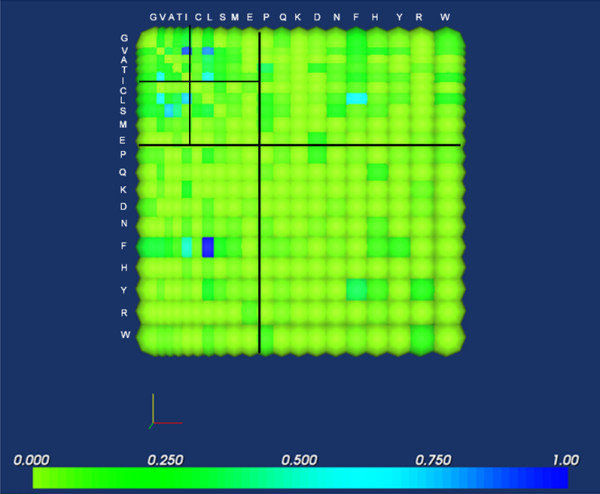
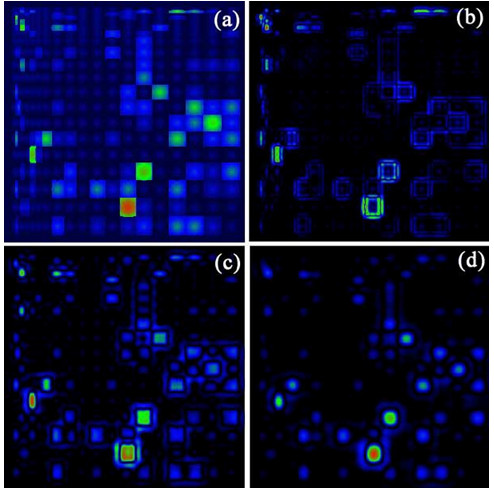
Background: It is useful to develop a tool that would effectively describe protein mutation matrices specifically geared towards the identification of mutations that produce either wanted or unwanted effects, such as an increase or decrease in affinity, or a predisposition towards misfolding. Here, we describe a tool where such mutations are efficiently identified, categorized and visualized. To categorize the mutations, amino acids in a mutation matrix are arranged according to one of three sets of physicochemical characteristics, namely hydrophilicity, size and polarizability, and charge and polarity. The magnitude and frequencies of mutations for an alignment are subsequently described using color information and scaling factors.

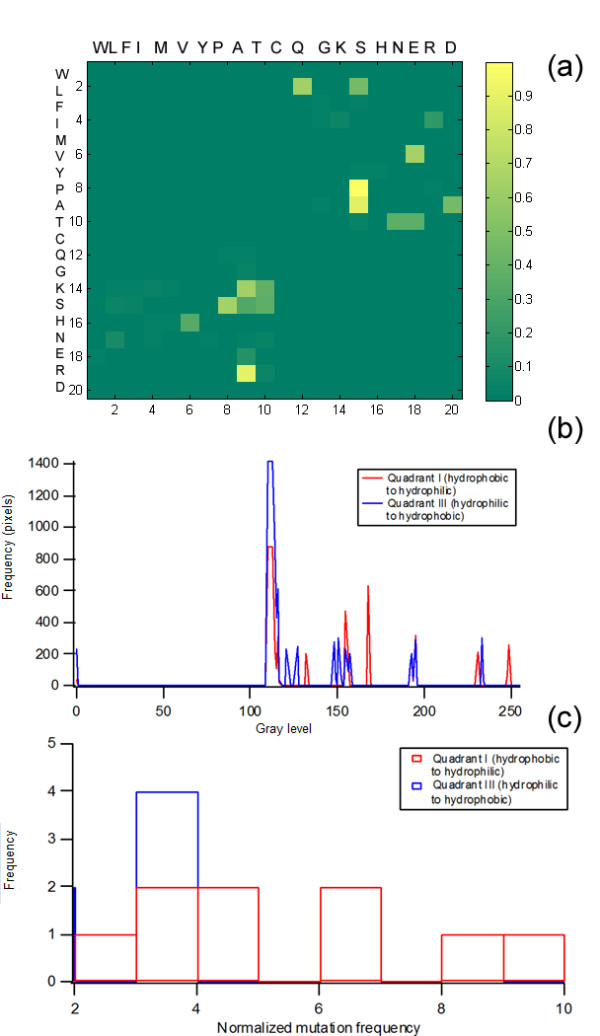
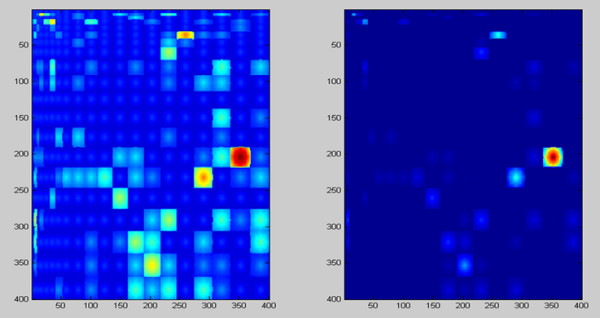
Results: To illustrate the capabilities of our approach, the technique is used to visualize and to compare mutation patterns in evolving sequences with diametrically opposite characteristics. Results show the emergence of distinct patterns not immediately discernible from the raw matrices.

Conclusion: Our technique enables effective categorization and visualization of mutations by using specifically-arranged mutation matrices. This tool has a number of possible applications in protein engineering, notably in simplifying the identification of mutations and/or mutation trends that are associated with specific engineered protein characteristics and behavior.


Figures

Figure 1
Figure 1
Mutation matrix generation. A raw mutation matrix is essentially a summary of the counts of all mutations from an amino acid in the reference sequence to every other amino acid in the sequences being compared to the reference. Its normalized equivalent is generated by dividing all the values in the matrix by the highest value found therein. Amino acids in the matrices are always arranged based on a particular physicochemical property. Normalization is done by dividing all entries in the matrix by the highest mutation frequency found in it. For a single alignment, it is possible to generate either one or multiple matrices, depending on the level of analysis that one wishes to subject it to.
Figure 2
Figure 2
Matrix scaling. The size of the cells in the mutation matrix is proportional to the numeric quantity of some property (e.g. size, hydrophilicity, or polarity) associated with each amino acid. The color of each cell corresponds to the frequency at which each mutation (or conservation) occurs with respect to the reference sequence.
Figure 3
Figure 3
Representative hydrophilicity mutation matrix. Elementary analysis may be performed by subdividing the matrix into four quadrants, where mutations in the second and fourth quadrants may be generally associated with more conservative mutations than those found in the first and third quadrants.
Figure 4
Figure 4
Mutation matrix subsets. Quadrants I and III of the mutation matrix shown in figure 3 were reproduced in order to demonstrate trends associated with these (A). Here, it is more evident that the most prominent mutations are located in Quadrant I (hydrophobic to hydrophilic mutations). The generation of a 256-bin histogram for the grayscale equivalent of the image (B), as well as a 10-bin histogram for the raw data (C) indicates that this is, in fact, the case.
Figure 5
Figure 5
Mutation patterns in amyloidogenic (A) and non-amyloidogenic (B) buried framework residues. Amino acids were arranged by increasing hydrophilicity. These matrices were compared to identify the characteristics of mutations exclusively associated with either matrix (Fig. 4C). Mutations that occur exclusively in amyloidogenic sequences are in dark blue, while those associated with non-amyloidogenic sequences are in aqua. Encircled regions correspond to mutation clusters that appear to be predominantly associated with amyloidosis.
Figure 6
Figure 6
Mutation patterns in CDRs and FRs of high-affinity antibody sequences. The matrices shown were generated from the analysis of affinity-matured anti-thyroid peroxidase antibodies (anti-TPO, KD = 10-9) derived from six different germlines. No distinction between mutations in light and heavy chains were made. The colored spots indicate the positions of artificially-introduced mutations in engineered antibodies that were associated with decreased affinity (Table 4); each mutation is indicated in two different matrices, since the exposure patterns of these residues were not indicated in the original references. These mutations were never observed for high-affinity antibodies. Unscaled, grayscale matrices were used to improve contrast.
Figure 7
Figure 7
Hemagglutinin H5 hydrophilicity mutation matrix. Note the localization of the most prominent mutations in the second and fourth quadrants, indicating the predominance of mutations that tend to preserve hydrophilicity. These prominent mutations correspond to well-known conservative mutation pairs like Ile and Val and Lys and Arg; other prominent mutations are indicated in the figure.
Figure 8
Figure 8
Amino acid differences between short and long chain alcohol-binding olfactory receptors. Most prominent differences are concentrated in the the first and third quadrants, indicating the preferential occurrence of small residues in the binding regions of ORs that exclusively recognize long chain alcohols. It is inferred that the smaller side chains allow the binding of bigger molecules.
Figure 9
Figure 9
Denoising using a fixed-size wavelet transformation. The original image (A) was subjected to a fixed-size Mexican hat wavelet transformation (B) that effectively removed low frequency details.
Figure 10
Figure 10
Profile of the circularly symmetric two-dimensional wavelet-like basis functions at various values of scaling parameter, σ = 5, 10 and 15.
Figure 11
Figure 11
(a) Image representing a two-dimensional mapping of mutation matrix. Applying image processing routines to distinguish certain mutations is achieved by convolving the image with a wavelet-like basis function with scaling parameter (b) σ = 5, (c), σ = 10 and (d) σ = 15.

Similar articles

Cited by

References

    1. Dayhoff MO, Schwartz RM, Orcutt BC. Atlas of protein sequence and structure. Vol. 5. National Biomedical Research Foundation, Silver Spring, MD; 1978. A model of evolutionary change in proteins.
    1. Tomii K, Kanehisa M. Analysis of amino acid indices and mutation matrices for sequence comparison and structure prediction of proteins. Protein Engineering. 1996;9:27–36. doi: 10.1093/protein/9.1.27. - DOI - PubMed
    1. Sander C, Schneider R. Database of homology-derived protein structures. Proteins, Structure, Function and Genetics. 1991;9:56–68. doi: 10.1002/prot.340090107. - DOI - PubMed
    1. Pupko T, Bell RE, Mayrose I, Glaser F, Ben-Tal N. Rate4Site: an algorithmic tool for the identification of functional regions in proteins by surface mapping of evolutionary determinants within their homologues. Bioinformatics. 2002;18:S71–S77. doi: 10.1093/bioinformatics/18.8.1116. - DOI - PubMed
    1. Glaser F, Pupko T, Paz I, Bell RE, Bechor D, Martz E, Ben-Tal N. ConSurf: Identification of Functional Regions in Proteins by Surface-Mapping of Phylogenetic Information. Bioinformatics. 2002;19:1–3. - PubMed

MeSH terms

LinkOut - more resources