

The gene expression profiles of primary and metastatic melanoma yields a transition point of tumor progression and metastasis
- PMID: 18442402
- PMCID: PMC2408576
- DOI: 10.1186/1755-8794-1-13
The gene expression profiles of primary and metastatic melanoma yields a transition point of tumor progression and metastasis
Abstract
Background: The process of malignant transformation, progression and metastasis of melanoma is poorly understood. Gene expression profiling of human cancer has allowed for a unique insight into the genes that are involved in these processes. Thus, we have attempted to utilize this approach through the analysis of a series of primary, non-metastatic cutaneous tumors and metastatic melanoma samples.
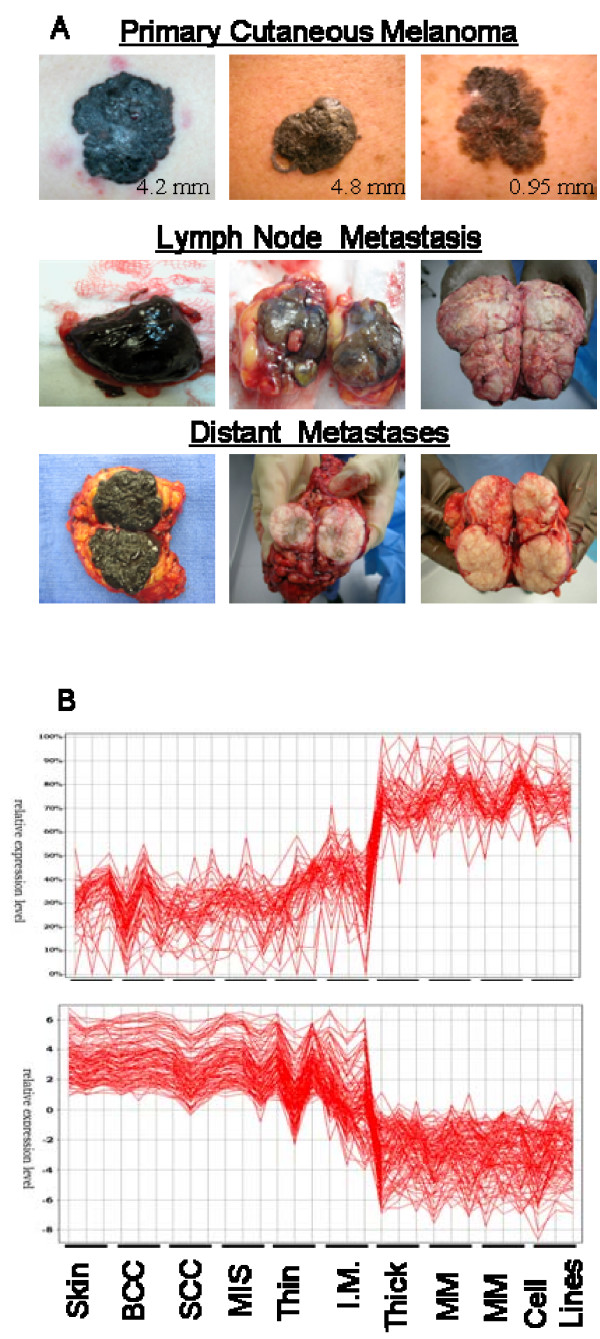
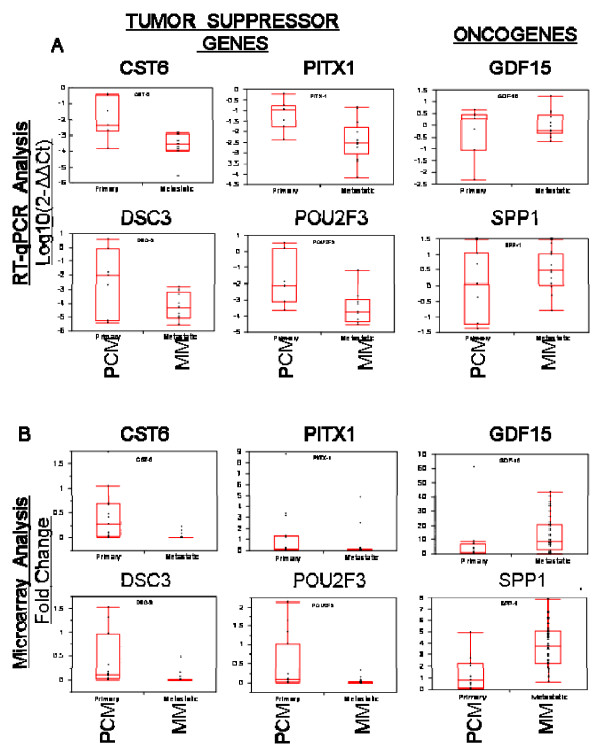
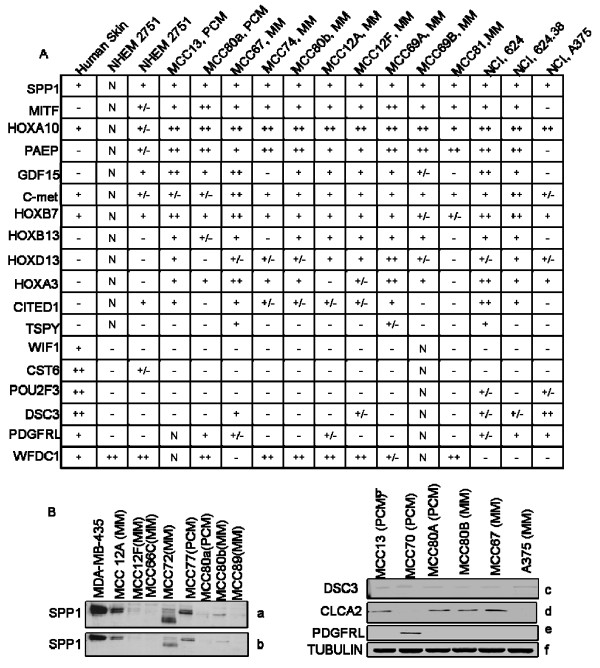
Methods: We have utilized gene microarray analysis and a variety of molecular techniques to compare 40 metastatic melanoma (MM) samples, composed of 22 bulky, macroscopic (replaced) lymph node metastases, 16 subcutaneous and 2 distant metastases (adrenal and brain), to 42 primary cutaneous cancers, comprised of 16 melanoma, 11 squamous cell, 15 basal cell skin cancers. A Human Genome U133 Plus 2.0 array from Affymetrix, Inc. was utilized for each sample. A variety of statistical software, including the Affymetrix MAS 5.0 analysis software, was utilized to compare primary cancers to metastatic melanomas. Separate analyses were performed to directly compare only primary melanoma to metastatic melanoma samples. The expression levels of putative oncogenes and tumor suppressor genes were analyzed by semi- and real-time quantitative RT-PCR (qPCR) and Western blot analysis was performed on select genes.
Results: We find that primary basal cell carcinomas, squamous cell carcinomas and thin melanomas express dramatically higher levels of many genes, including SPRR1A/B, KRT16/17, CD24, LOR, GATA3, MUC15, and TMPRSS4, than metastatic melanoma. In contrast, the metastatic melanomas express higher levels of genes such as MAGE, GPR19, BCL2A1, MMP14, SOX5, BUB1, RGS20, and more. The transition from non-metastatic expression levels to metastatic expression levels occurs as melanoma tumors thicken. We further evaluated primary melanomas of varying Breslow's tumor thickness to determine that the transition in expression occurs at different thicknesses for different genes suggesting that the "transition zone" represents a critical time for the emergence of the metastatic phenotype. Several putative tumor oncogenes (SPP-1, MITF, CITED-1, GDF-15, c-Met, HOX loci) and suppressor genes (PITX-1, CST-6, PDGFRL, DSC-3, POU2F3, CLCA2, ST7L), were identified and validated by quantitative PCR as changing expression during this transition period. These are strong candidates for genes involved in the progression or suppression of the metastatic phenotype.
Conclusion: The gene expression profiling of primary, non-metastatic cutaneous tumors and metastatic melanoma has resulted in the identification of several genes that may be centrally involved in the progression and metastatic potential of melanoma. This has very important implications as we continue to develop an improved understanding of the metastatic process, allowing us to identify specific genes for prognostic markers and possibly for targeted therapeutic approaches.
Figures
References
-
- Jemal A, Siegel R, Ward E, Murray T, Xu J, Thun MJ. Cancer Statistics, 2007. CA Cancer J Clin. 2007;57:43–66. - PubMed
-
- Eton O, Legha SS, Moon TE, Buzaid AC, Papadopoulos NE, Plager C, Burgess AM, Beidikian AY, Ring S, Dong O, Glassman AB, Balch CM, Benjamin RS. Prognostic factors for survival of patients treated systemically for disseminated melanoma. J Clin Oncol. 1998;16:1103–1111. - PubMed
-
- Cascinelli N, Belli F, Santinami M, Fait V, Testori A, Ruka W, Cavaliere R, Mozzillo N, Rossi CR, MacKie RM, Nieweg O, Pace M, Kirov K. Sentinel lymph node biopsy in cutaneous melanoma: The WHO Melanoma Program experience. Ann Surg Oncol. 2000;7:469–474. doi: 10.1007/s10434-000-0469-z. - DOI - PubMed
Grants and funding
LinkOut - more resources
Full Text Sources
Other Literature Sources
Molecular Biology Databases
Research Materials
Miscellaneous
