. 2008 Apr 28:6:11.
doi: 10.1186/1741-7015-6-11.

Collagen density promotes mammary tumor initiation and progression

Affiliations

Collagen density promotes mammary tumor initiation and progression

Paolo P Provenzano et al. BMC Med. .

Abstract

Background: Mammographically dense breast tissue is one of the greatest risk factors for developing breast carcinoma. Despite the strong clinical correlation, breast density has not been causally linked to tumorigenesis, largely because no animal model has existed for studying breast tissue density. Importantly, regions of high breast density are associated with increased stromal collagen. Thus, the influence of the extracellular matrix on breast carcinoma development and the underlying molecular mechanisms are not understood.

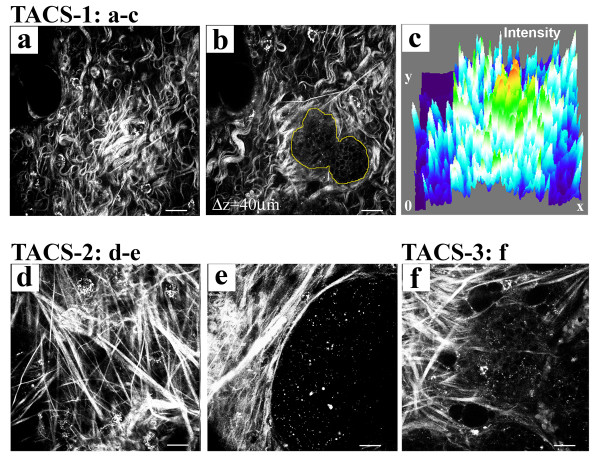
Methods: To study the effects of collagen density on mammary tumor formation and progression, we utilized a bi-transgenic tumor model with increased stromal collagen in mouse mammary tissue. Imaging of the tumors and tumor-stromal interface in live tumor tissue was performed with multiphoton laser-scanning microscopy to generate multiphoton excitation and spectrally resolved fluorescent lifetimes of endogenous fluorophores. Second harmonic generation was utilized to image stromal collagen.

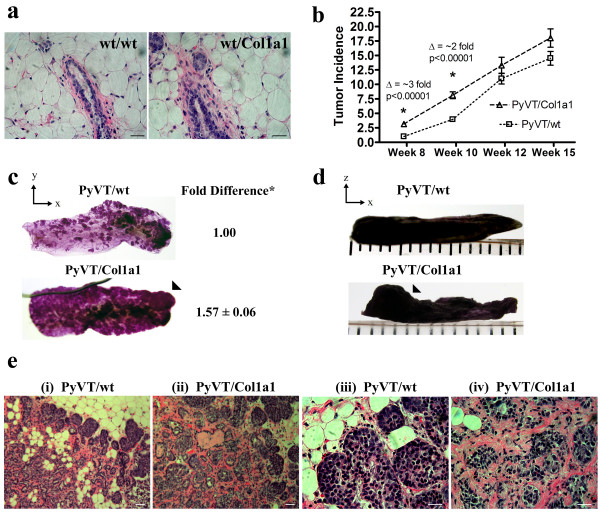
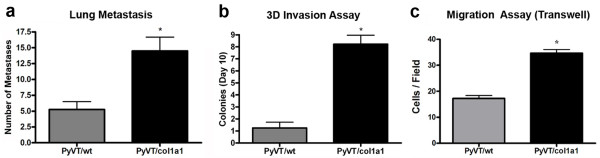
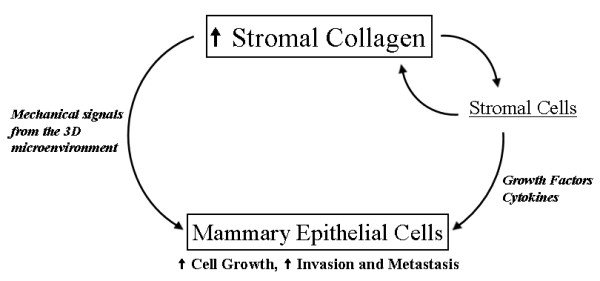
Results: Herein we demonstrate that increased stromal collagen in mouse mammary tissue significantly increases tumor formation approximately three-fold (p < 0.00001) and results in a significantly more invasive phenotype with approximately three times more lung metastasis (p < 0.05). Furthermore, the increased invasive phenotype of tumor cells that arose within collagen-dense mammary tissues remains after tumor explants are cultured within reconstituted three-dimensional collagen gels. To better understand this behavior we imaged live tumors using nonlinear optical imaging approaches to demonstrate that local invasion is facilitated by stromal collagen re-organization and that this behavior is significantly increased in collagen-dense tissues. In addition, using multiphoton fluorescence and spectral lifetime imaging we identify a metabolic signature for flavin adenine dinucleotide, with increased fluorescent intensity and lifetime, in invading metastatic cells.

Conclusion: This study provides the first data causally linking increased stromal collagen to mammary tumor formation and metastasis, and demonstrates that fundamental differences arise and persist in epithelial tumor cells that progressed within collagen-dense microenvironments. Furthermore, the imaging techniques and signature identified in this work may provide useful diagnostic tools to rapidly assess fresh tissue biopsies.


Figures

Figure 1
Figure 1
Increased collagen matrix density directly promotes epithelial cell proliferation. (a) Actin staining to visualize MCF10A human mammary epithelial cells cultured within low (1.3 mg/ml) and high-density (3.0 mg/ml) collagen gels for 21 days (actin, green; nuclei, blue). Left: Two well-differentiated acini structures formed in low-density matrices. Right: A single, less-organized colony. (b) Increased proliferation of mammary epithelial cells cultured within high-density matrices, measured by increased detection of the Ki67 antigen, a marker of proliferation.
Figure 2
Figure 2
High mammary collagen density promotes tumor formation. (a) Histology of mammary glands from 10-week-old wild-type and heterozygous Col1a1tmJae mice showing increased stromal collagen and hypercellularity associated with the Col1a1tmJae mouse model. Scale bar 25 μm. (b) Significantly increased tumor numbers per mouse in collagen-dense (Col1a1) mammary glands. (c) Whole mount preparations of the fourth inguinal mammary glands from PyVT/wt and PyVT/Col1a1 mice at 10 weeks of age. Quantitative analysis of the area of hyperplasia from three pairs of glands calculated from a common threshold value set with density slicing in ImageJ software revealed a greater than 1.5-fold increase in hyperplasia associated with increased stromal collagen (t-test: p = 0.03). In addition, at age-matched time points, tumors in mice with dense stroma not only displayed more hyperplastic area but also tumor regions that grew out away from the gland (arrows in (c) and (d)). (e) Low (i), (ii) and high (iii), (iv) magnification images of H&E stained histology sections from 10-week-old mice showing increased collagen in PyVT/Col1a1 tumors ((ii) and (iv)) and a more invasive phenotype when compared with PyVT/wt (i) and (iii) tumors. Scale bars 50 μm in (i) and (ii) and 25 μm in (iii) and (iv).
Figure 3
Figure 3
Increased metastasis associated with dense stromal collagen. (a) Increased number of lung metastases per lung at 15 weeks in mice that formed tumors in collagen-dense mammary glands (PyVT/Col1a1) when compared with mice that formed tumors in control glands (PyVT/wt; mean ± standard error of the mean (SEM), n = 4 of each genotype). (b) Three-dimensional tumor cell invasion assay showing that tumor explants from collagen-dense tumors (PyVT/Col1a1) resulted in more invasion into three-dimensional collagen gels and colony formation after 10 days than explants from PyVT/wt tumors (mean ± SEM; n = 4 PyVT/wt and n = 14 PyVT/Col1a1 tumor explants from four sibling mice). (c) Tumor cells extracted from collagen-dense tumors (PyVT/Col1a1) showed increased migration when compared to tumor cells from control tumors (PyVT/wt) as measured by transwell migration assays with serum as the chemoattractant (mean ± SEM; n ≥ 3 independent experiments). *Indicates a statistically significant difference (p < 0.05) following analysis with t-tests.
Figure 4
Figure 4
Tumor-associated collagen signatures. (a)-(c) Example of TACS-1. A region of locally dense collagen (a) near (40 μm 'above') a small tumor region (b) that is within the globally increased collagen region surrounding tumors, resulting from increased SHG (collagen) signal intensity; (c) three-dimensional surface plot of intensity showing an approximately three-fold signal increase at TACS-1. (d), (e) Example of TACS-2, showing straightened (taut) collagen fibers stretched around and constraining an expanded epithelial tumor volume. At regions of TACS-2, quantitative analysis [27] of fiber angles relative to the tumor boundary shows a distribution of fibers around 0° that correlates to non-invading regions of tumor cells. (f) Example of TACS-3, showing radially aligned collagen fibers, reorganized by tumor cells, at regions of tumor cell invasion. At regions of TACS-3, quantitative analysis [27] of fiber angles relative to the tumor boundary shows a distribution of fibers around 90° that correlates with local invasion of tumor cells.
Figure 5
Figure 5
Increased progression of tumor-associated collagen signatures and increased local invasion with high collagen density. (a) TACS-1 in 8-week-old normal (wild-type; (i), (ii)) and collagen-dense (col1a1; (iii), (iv)) tumors showing more developed TACS-1 associated with density (early transition between TACS-1 and -2) while showing very early TACS-1 formation in wild-type tumors (shown with yellow arrowheads; white arrowhead indicates a TACS-1 region that is not shown since it is out of the focal plane). The displayed tumor regions ((ii) and (iv)) are at a Δz = 40 μm from collagen signatures ((i) and (iii)). Note the increased endogenous cellular autofluorescence associated with tumor cells in collagen-dense tissues when PyVT/wt (ii) and PyVT/Col1a1 (iv) tumors were imaged sequentially at the same power settings ((ii) versus (iv)). Representative of n = 4 pairs of tumors. (b) Tumors were imaged and MPE (pseudo-colored red) and SHG (pseudo-colored green) signals were separated. At 8 weeks tumors showed early TACS-3 regions and some local invasion in collagen-dense tumors (ii) while PyVT/wt tumors (i) were still primarily bound by collagen (TACS-2) and non-invasive. At 10 weeks, tumors from dense tissues (iv) displayed further regions of TACS-3 progression and an invasive phenotype, compared to control tissues (iii) that were largely non-invasive and had little collagen reorganization. Representative of n ≥ 6 tumors from each background. (c) Quantitative analysis of collagen fiber angles relative to the tumor boundary for 8-week (top) and 10-week (bottom) old animals. PyVT/wt animals displayed little TACS-3 and are primarily non-invasive with only 23% (8 weeks) and 24% (10 weeks) of their fibrils having angles outside of the TACS-2 distribution around 0° (that is less than -15° or more than 15°). In contrast PyVT/Col1a1 tumors were more invasive, possessing a broader fiber distribution and some regions of TACS-3 (distribution around 90°), with 46% and 51% of the fibrils distributed outside of the TACS-2 distribution (0°) at 8 weeks and 10 weeks, respectively (*indicates that the number of events associated with TACS-3/invasion (75° to 105°) was significantly greater). Calculated from at least 185 of tumor regions from at least 6 separate tumors. All scale bars are 25 μm.
Figure 6
Figure 6
FLIM an SLIM analysis of mammary tumors. (a) Multiphoton spectral lifetime imaging microscopy (SLIM) analysis of the emission spectrum from endogenous fluorescence resulting from excitation at 890 nm. The emission signals were separated by 10 nm spectral steps over 16 channels (10 channels are displayed) and the photons collected in each channel used to generate fluorescence lifetime images and signals for each channel plotted with SLIM-Plotter (shown). Emission from collagen (at half of the input wavelength) showed a very strong and sharp signal with a no appreciable decay (lifetime) confirming the SHG nature of the collagen signal (top). Emission spectra of endogenous fluorescence from tumor and stromal cells showed that the only substantial emission signal is at 530 nm, indicating that the source of the autofluorescence signal is FAD, with lifetime values from the 530 channel matching values obtained with fluorescence lifetime imaging microscopy (FLIM). (b) Multiphoton intensity and FLIM images of the stroma near a tumor (top) and the tumor and stromal components (bottom) from wild-type tumors showing the utility of FLIM to image tumor cells, stromal cells, and extracellular matrix components. Note the increased intensity and fluorescent lifetimes of stromal cells (quantified in (c)) and the low lifetime of collagen (matching system response, that is, no actual lifetime/color mapping toward blue). The color map in (b) represents the weighted average of the two-term model components (τm = (a1τ1 + a2τ2)/(a1 + a2)) using the equation shown in (c). (c) Quantitative analysis of fluorescent lifetime components from tumor and stromal (subscript s) cells using the equation shown. Note the increase in the second (long) component and weighted mean component (see the equation above) for stromal cells when compared with cells from the primary tumor mass. Note that at least 30 measurements per tumor image from 4 independent tumors were used to calculate lifetime values for tumor cells in the primary tumor mass while at least 6 measurements per tumor image from 4 independent tumors were used for stromal cells. *Indicates a statistically significant (p < 0.05) difference following analysis with one-way analysis of variance (ANOVA) with a post-hoc Tukey-Kramer test.
Figure 7
Figure 7
Fluorescence lifetime imaging microscopy analysis of invading tumor cells. (a) Intensity and fluorescence lifetime imaging microscopy (FLIM) images of cells away from and near invasive TACS-3 regions showing increased fluorescent intensity and lifetime near invasive regions (left side of images). (b) FLIM images of tumors from 10-week-old PyVT/wt and PyVT/Col1a1 animals confirming the increased TACS-3 for collagen-dense tumors shown in Figure 5. (c) Increased fluorescent lifetimes for invading cells. Like stromal cells the second (long) and mean components are increased in invading cells. However, the short component is also increased in invading cells when compared to cells in the primary tumor mass. Note, 45 measurements for cells within the primary tumor mass and 45 measurements for invading cells adjacent to the tumor primary tumor mass were used to calculate lifetime values. (d) The second (long) component from cells within the primary tumor mass, invading tumor cells, and stromal cells showing a progressive increase as cells move from a primary epithelial tumor phenotype to a more migratory phenotype. *Indicates a statistically significant (p < 0.05) difference following analysis with one-way analysis of variance (ANOVA) with a post-hoc Tukey-Kramer test.
Figure 8
Figure 8
Model for advancement of mammary epithelial tumors by increased stromal collagen. Increased fibrillar collagen in the mammary stroma directly regulates the three-dimensional mechanical microenvironment of mammary epithelial cells, influencing proliferation and phenotype. In addition, increased collagen advances a feed-forward loop with fibroblasts to promote additional collagen deposition and an increased stromal/fibroblast population resulting in increased paracrine signaling to mammary epithelial cells. The net result is increased epithelial proliferation/tumor formation and a more invasive and metastatic phenotype.

References

    1. McCormack VA, dos Santos Silva I. Breast density and parenchymal patterns as markers of breast cancer risk: a meta-analysis. Cancer Epidemiol Biomarkers Prev. 2006;15:1159–1169. doi: 10.1158/1055-9965.EPI-06-0034. - DOI - PubMed
    1. Boyd NF, Lockwood GA, Byng JW, Tritchler DL, Yaffe MJ. Mammographic densities and breast cancer risk. Cancer Epidemiol Biomarkers Prev. 1998;7:1133–1144. - PubMed
    1. Boyd NF, Martin LJ, Stone J, Greenberg C, Minkin S, Yaffe MJ. Mammographic densities as a marker of human breast cancer risk and their use in chemoprevention. Curr Oncol Rep. 2001;3:314–321. doi: 10.1007/s11912-001-0083-7. - DOI - PubMed
    1. Boyd NF, Dite GS, Stone J, Gunasekara A, English DR, McCredie MR, Giles GG, Tritchler D, Chiarelli A, Yaffe MJ, Hopper JL. Heritability of mammographic density, a risk factor for breast cancer. N Engl J Med. 2002;347:886–894. doi: 10.1056/NEJMoa013390. - DOI - PubMed
    1. Boyd NF, Rommens JM, Vogt K, Lee V, Hopper JL, Yaffe MJ, Paterson AD. Mammographic breast density as an intermediate phenotype for breast cancer. Lancet Oncol. 2005;6:798–808. doi: 10.1016/S1470-2045(05)70390-9. - DOI - PubMed

Publication types

MeSH terms

Substances

LinkOut - more resources