. 2008 Jun 20;283(25):17147-57.
doi: 10.1074/jbc.M802447200. Epub 2008 Apr 28.

Development of oxidative stress by cytochrome P450 induction in rodents is selective for barbiturates and related to loss of pyridine nucleotide-dependent protective systems

Affiliations

Development of oxidative stress by cytochrome P450 induction in rodents is selective for barbiturates and related to loss of pyridine nucleotide-dependent protective systems

Miroslav Dostalek et al. J Biol Chem. .

Abstract

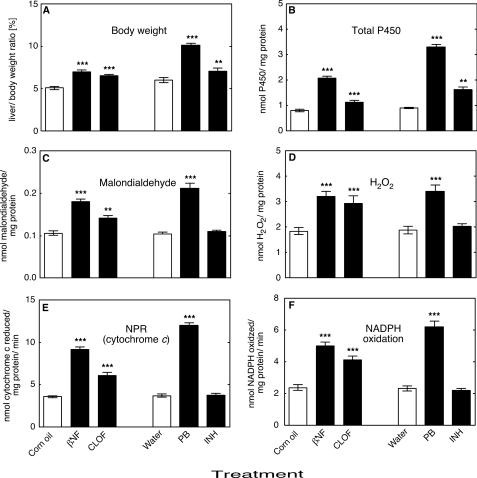
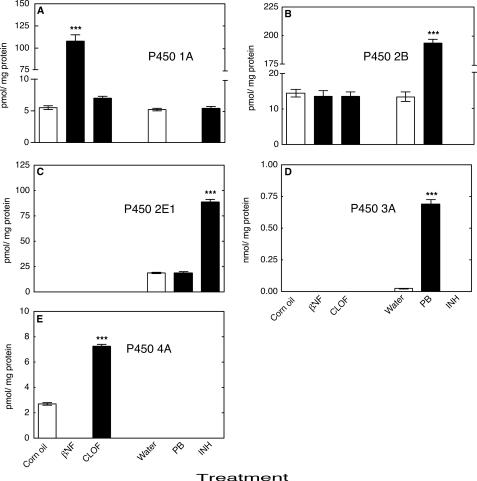
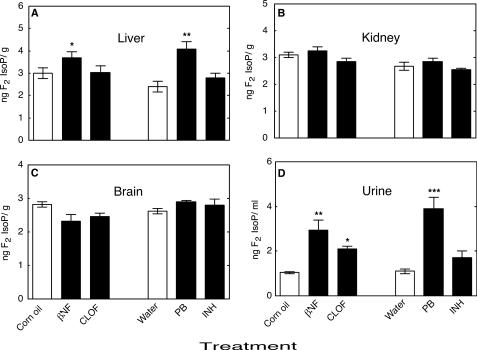
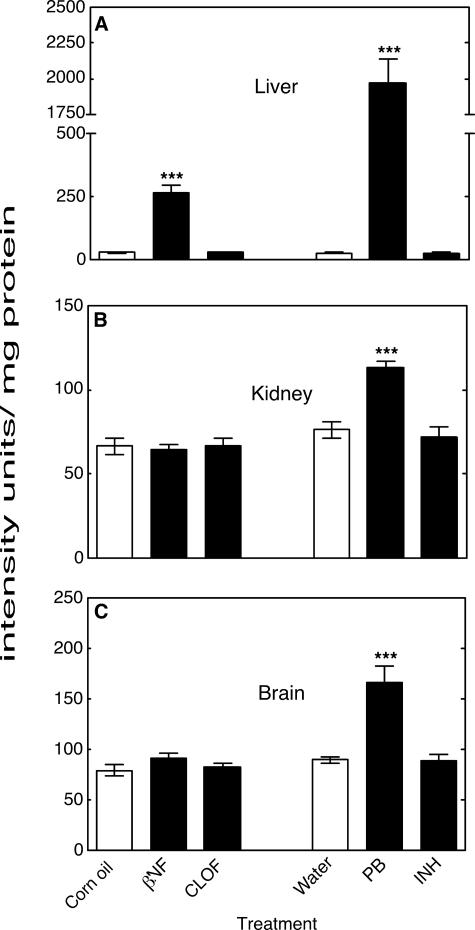
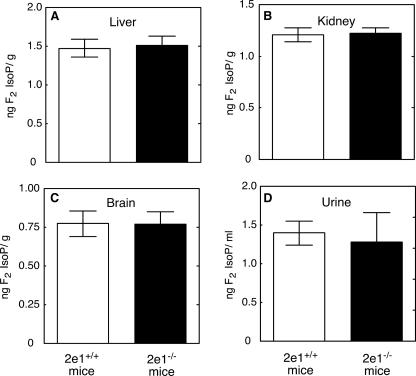
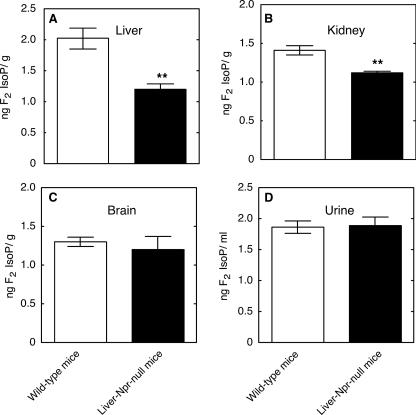
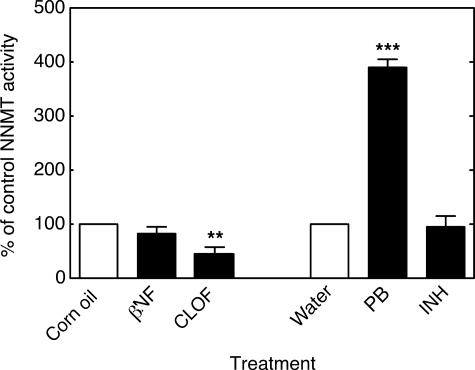
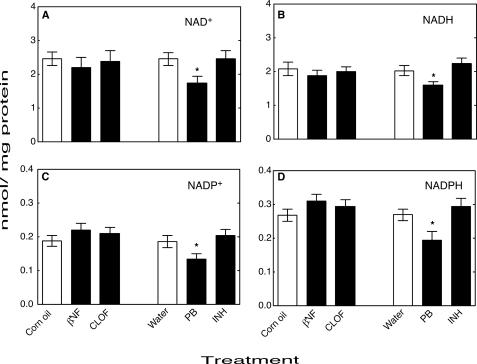
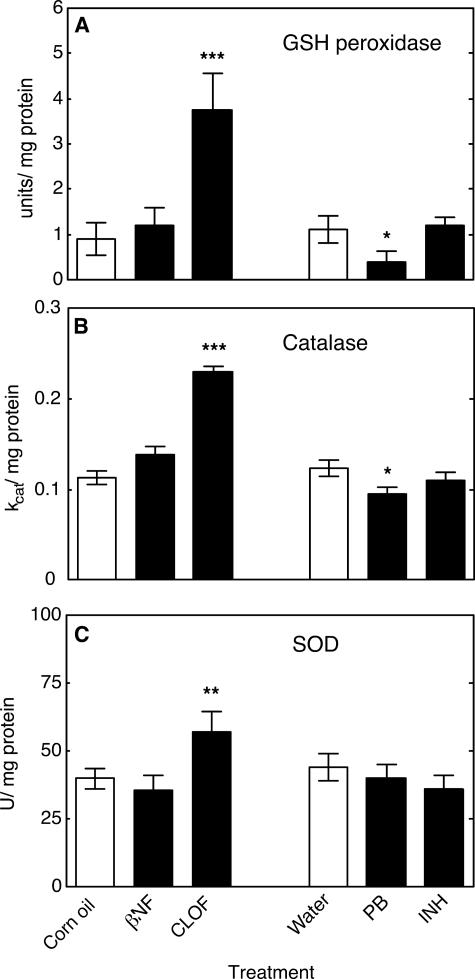
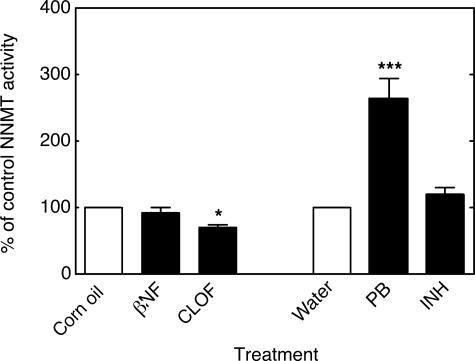
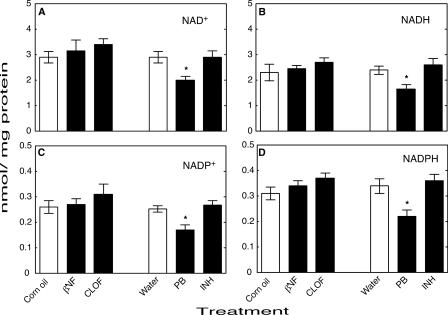
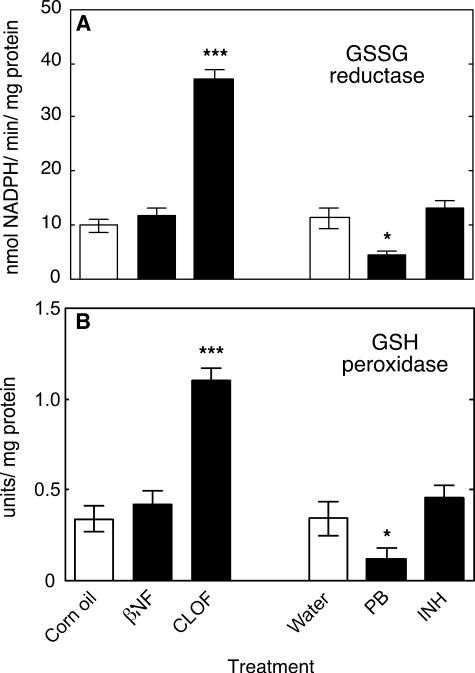
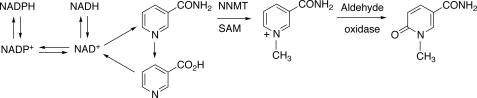
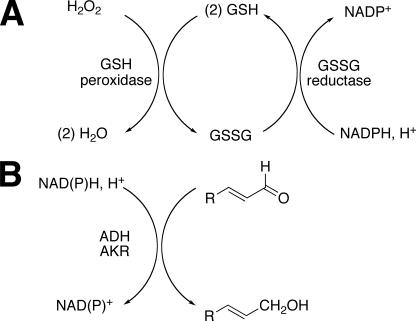
Reactive oxygen species (ROS) and oxidative stress have been considered in a variety of disease models, and cytochrome P450 (P450) enzymes have been suggested to be a source of ROS. Induction of P450s by phenobarbital (PB), beta-naphthoflavone (betaNF), or clofibrate in a mouse model increased ROS parameters in the isolated liver microsomes, but isoniazid treatment did not. However, when F(2)-isoprostanes (F(2)-IsoPs) were measured in tissues and urine, PB showed the strongest effect and betaNF had a measurable but weaker effect. The same trend was seen when an Nfr2-based transgene reporter sensitive to ROS was analyzed in the mice. This pattern had been seen earlier with F(2)-IsoPs both in vitro and in vivo with rats (Dostalek, M., Brooks, J. D., Hardy, K. D., Milne, G. L., Moore, M. M., Sharma, S., Morrow, J. D., and Guengerich, F. P. (2007) Mol. Pharmacol. 72, 1419-1424). One possibility for the general in vitro-in vivo discrepancy in oxidative stress found in both mice and rats is that PB treatment might attenuate protective systems. One potential candidate suggested by an mRNA microarray was nicotinamide N-methyltransferase. PB was found to elevate nicotinamide N-methyltransferase activity 3- to 4-fold in mice and rats and to attenuate levels of NAD(+), NADP(+), NADH, and NADPH in both species (20-40%), due to the enhanced excretion of (N-methyl)nicotinamide. PB also down-regulated glutathione peroxidase and glutathione reductase, which together constitute a key enzymatic system that uses NADPH in protecting against oxidative stress. These multiple effects on the protective systems are proposed to be more important than P450 induction in oxidative stress and emphasize the importance of studying in vivo models.


Figures

FIGURE 1.
FIGURE 1.
Effects of treatments on liver/body weight ratio and in vitro liver microsomal parameters. A, liver/body weight ratio; B, total microsomal P450; C, formation of malondialdehyde; D, microsomal H2O2 production; E, microsomal NADPH oxidation; F, microsomal NADPH-cytochrome c reduction (NPR) (specific activity). All values are presented as means ± S.E. (n = 5) and statistical significance relative to the appropriate vehicle control (within each group, indicated by the open bar in each set) (**, p < 0.01; ***, p < 0.001).
FIGURE 2.
FIGURE 2.
Induction of mouse liver P450s. Levels were estimated immunochemically and expressed in terms of comparison with the indicated rat P450s. P450 1A1 and 1A2 proteins were not resolved, whereas multiple P450 2B, 3A, or 4A proteins were detected. The values represent combined levels of all proteins detected for each P450 Subfamily. A, P450 1A Subfamily (rat P450 1A1 used as standard); B, P450 2B Subfamily (rat P450 2B1 used as standard); C, P450 2E1 (rat P450 2E1 used as standard); D, P450 3A Subfamily (rat P450 3A1 used as standard); E, P450 4a Subfamily (rat P450 4A1 used as standard). All values are presented as means ± S.E. (n = 5) and statistical significance relative to the appropriate vehicle control (within each group, indicated by the open bar in each set) (***, p < 0.001). Measurements were not made in the blank sections of parts C–E.
FIGURE 3.
FIGURE 3.
Measurements of F2-isoP levels in tissue and urine samples from ARE-reporter mice. A, liver F2-isoPs; B, kidney F2-isoPs; C, brain F2-isoPs; D, urinary F2-isoPs. All values are presented as means ± S.E. (n = 5), with statistical significance indicated (*, p < 0.05; **, p < 0.01; and ***, p < 0.001).
FIGURE 4.
FIGURE 4.
Measurements of ARE-reporter enzyme activity in mouse tissue samples. A, liver ARE-reporter activity; B, kidney ARE-reporter activity; C, brain ARE-reporter activity. All values are presented as means ± S.E. (n = 5), with statistical significance indicated (***, p < 0.001).
FIGURE 5.
FIGURE 5.
Measurements of F2-isoP levels in tissue and urine samples from Cyp2e1–/– and Cyp2e1+/+ mice. A, liver F2-isoPs; B, kidney F2-isoPs; C, brain F2-isoPs; D, urinary F2-isoPs. All values are presented as means ± S.E. (n = 5). No statistical significance was found in any case.
FIGURE 6.
FIGURE 6.
Measurements of F2-isoPs levels in tissue and urine samples from liver-Npr-null and wild-type mice. A, liver F2-isoPs; B, kidney F2-isoPs; C, brain F2-isoPs; D, urinary F2-isoPs. All values are presented as means ± S.E. (n = 5), with statistical significance indicated (**, p < 0.01).
FIGURE 7.
FIGURE 7.
Effects of treatments on NNMT activity in mouse liver. All values are presented as means ± S.E. (n = 5) and statistical significance relative to the appropriate vehicle control (within each group, indicated by the open bar in each set) (**, p < 0.01; ***, p < 0.001).
FIGURE 8.
FIGURE 8.
Effects of treatments on levels of pyridine nucleotides in mouse liver. A, NAD+; B, NADH; C, NADP+; D, NADPH. All values are presented as means ± S.E. (n = 5) and statistical significance relative to the appropriate vehicle control (within each group, indicated by the open bar in each set) (*, p < 0.05).
FIGURE 9.
FIGURE 9.
Effects of treatments on activity of protective enzyme systems in mouse liver. A, GSH peroxidase (one unit of GSH peroxidase activity is defined as that amount of enzyme catalyzing oxidation of 1 μmol min–1 of GSH (52)); B, catalase (activity was calculated based on kcat = 2.3/dt(C0/Ct), dt = 1 min) (46); C, SOD. One unit of SOD activity is defined as inhibition of xanthine oxidase-dependent cytochrome c reduction by 50% in this assay. All values are presented as means ± S.E. (n = 5) and statistical significance relative to the appropriate vehicle control (within each group, indicated by the open bar in each set) (**, p < 0.01; ***, p < 0.001).
FIGURE 10.
FIGURE 10.
Effects of treatments on NNMT activity in rat liver. All values are presented as means ± S.E. (n = 6) and statistical significance relative to the appropriate vehicle control (within each group, indicated by the open bar in each set) (*, p < 0.05; ***, p < 0.001).
FIGURE 11.
FIGURE 11.
Effects of treatments on levels of pyridine nucleotides in rat liver. A, NAD+; B, NADH; C, NADP+; D, NADPH. All values are presented as means ± S.E. (n = 6) and statistical significance relative to the appropriate vehicle control (within each group, indicated by the open bar in each set) (*, p < 0.05).
FIGURE 12.
FIGURE 12.
Effects of treatments on activities of protective enzymes in rat liver. A, GSSG reductase. Activity was calculated using Δε340 = 6.22 mm–1 cm–1 for NADPH oxidation; B, GSH peroxidase (one unit of GSH peroxidase is activity defined as that amount of enzyme catalyzing the oxidation of 1 μmol of GSH min–1 in the presence of H2O2 (52)). All values are presented as means ± S.E. (n = 6) and statistical significance relative to the appropriate vehicle control (within each group, indicated by the open bar in each set) (*, p < 0.05; ***, p < 0.001).
FIGURE 13.
FIGURE 13.
Competition of NNMT methylation and utilization of nicotinamide for pyridine nucleotide synthesis. SAM, S-adenosylmethionine.
FIGURE 14.
FIGURE 14.
Detoxication of reactive species. A, H2O2 and GSH peroxidase system; B, reduction of reactive aldehydes by NAD(P)H. ALDH, aldehyde dehydrogenase; AKR, aldo-keto reductase.

Similar articles

Cited by

References

    1. Valko, M., Leibfritz, D., Moncol, J., Cronin, M. T., Mazur, M., and Telser, J. (2007) Int. J. Biochem. Cell Biol. 39 44–84 - PubMed
    1. Palmer, G., and Reedijk, J. (1992) J. Biol. Chem. 267 665–677 - PubMed
    1. Jabs, T. (1999) Biochem. Pharmacol. 57 231–245 - PubMed
    1. Finkel, T., and Holbrook, N. J. (2000) Nature 408 239–247 - PubMed
    1. Lee, S. R., Yang, K. S., Kwon, J., Lee, C., Jeong, W., and Rhee, S. G. (2002) J. Biol. Chem. 277 20336–20342 - PubMed

Publication types