. 2008 Jun 20;283(25):17194-204.
doi: 10.1074/jbc.M801713200. Epub 2008 Apr 28.

Activation of 5-HT2A/C receptors counteracts 5-HT1A regulation of n-methyl-D-aspartate receptor channels in pyramidal neurons of prefrontal cortex

Affiliations

Activation of 5-HT2A/C receptors counteracts 5-HT1A regulation of n-methyl-D-aspartate receptor channels in pyramidal neurons of prefrontal cortex

Eunice Y Yuen et al. J Biol Chem. .

Abstract

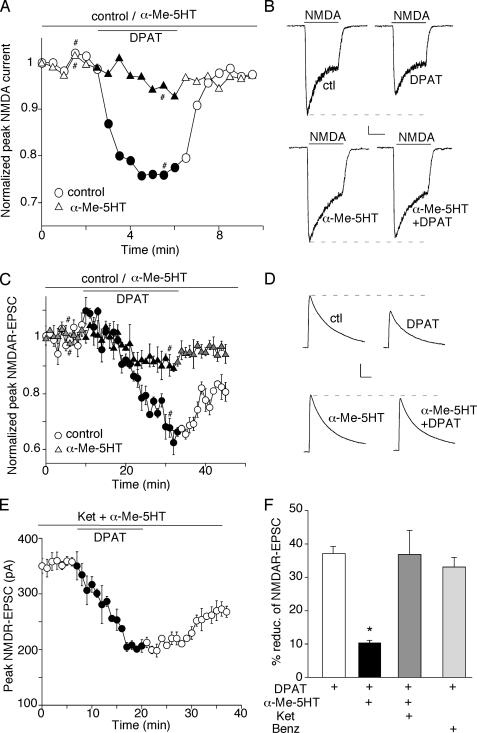
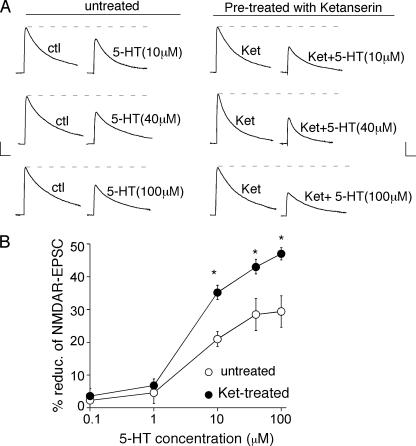
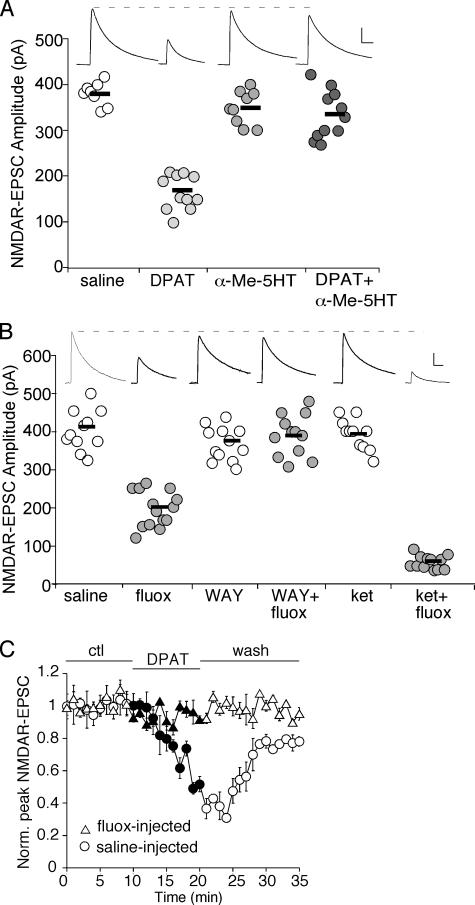
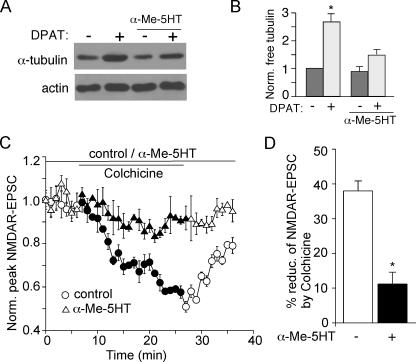
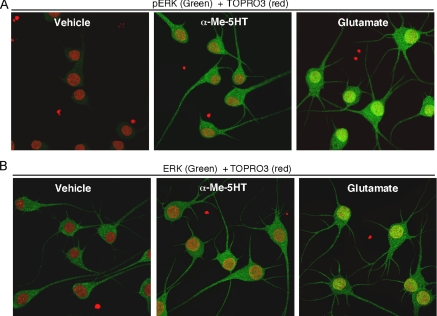
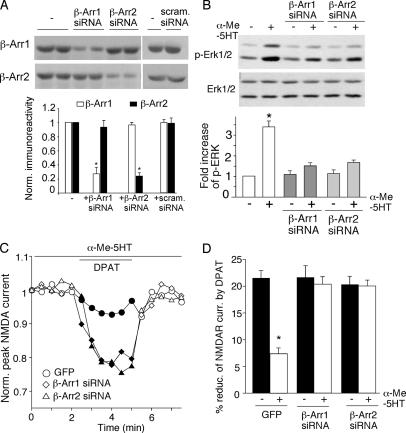
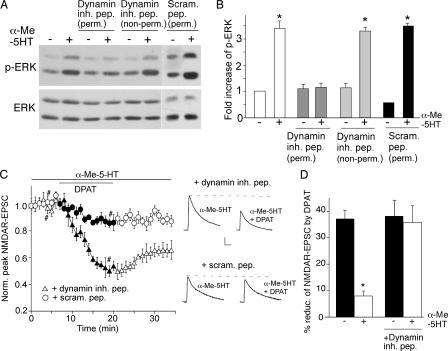
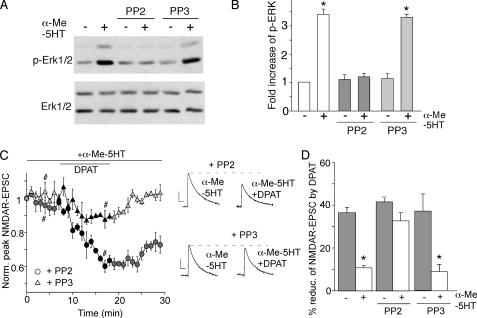
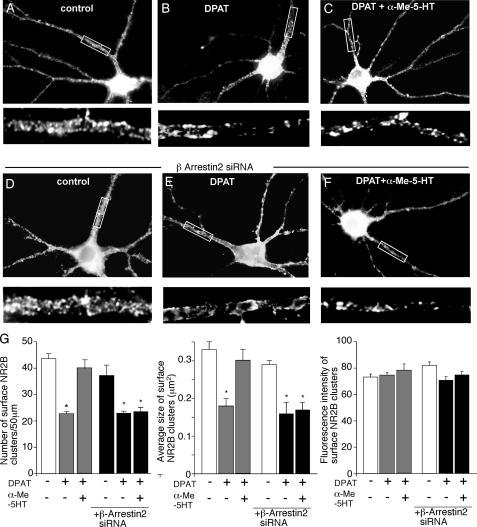
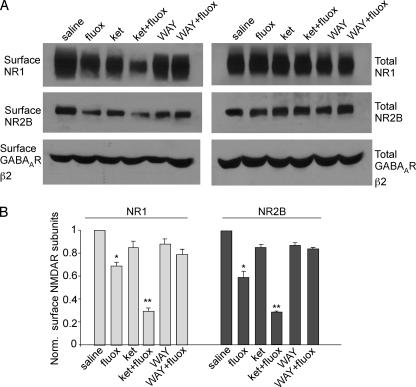
Abnormal serotonin-glutamate interaction in prefrontal cortex (PFC) is implicated in the pathophysiology of many mental disorders, including schizophrenia and depression. However, the mechanisms by which this interaction occurs remain unclear. Our previous study has shown that activation of 5-HT(1A) receptors inhibits N-methyl-D-aspartate (NMDA) receptor (NMDAR) currents in PFC pyramidal neurons by disrupting microtubule-based transport of NMDARs. Here we found that activation of 5-HT(2A/C) receptors significantly attenuated the effect of 5-HT(1A) on NMDAR currents and microtubule depolymerization. The counteractive effect of 5-HT(2A/C) on 5-HT(1A) regulation of synaptic NMDAR response was also observed in PFC pyramidal neurons from intact animals treated with various 5-HT-related drugs. Moreover, 5-HT(2A/C) stimulation triggered the activation of extracellular signal-regulated kinase (ERK) in dendritic processes. Inhibition of the beta-arrestin/Src/dynamin signaling blocked 5-HT(2A/C) activation of ERK and the counteractive effect of 5-HT(2A/C) on 5-HT(1A) regulation of NMDAR currents. Immunocytochemical studies showed that 5-HT(2A/C) treatment blocked the inhibitory effect of 5-HT(1A) on surface NR2B clusters on dendrites, which was prevented by cellular knockdown of beta-arrestins. Taken together, our study suggests that serotonin, via 5-HT(1A) and 5-HT(2A/C) receptor activation, regulates NMDAR functions in PFC neurons in a counteractive manner. 5-HT(2A/C), by activating ERK via the beta-arrestin-dependent pathway, opposes the 5-HT(1A) disruption of microtubule stability and NMDAR transport. These findings provide a framework for understanding the complex interactions between serotonin and NMDARs in PFC, which could be important for cognitive and emotional control in which both systems are highly involved.


Figures

FIGURE 1.
FIGURE 1.
Activation of 5-HT2A/C receptors counteracts the 5-HT1A -induced reduction of NMDAR-mediated ionic and synaptic currents in PFC pyramidal neurons. A and C, plot of normalized peak NMDAR currents (A) or NMDAR-EPSC (C) as a function of time and 8-OH-DPAT (5-HT1A agonist, 20 μm) application in neurons treated with or without α-Me-5HT (5-HT2A/C agonist, 20 μm). Each point (C) represents the average peak (mean ± S.E.) of three consecutive NMDAR-EPSC. B and D, representative current traces taken from the records used to construct A or C (at time points denoted by #). Scale bars: 100 pA, 1 s (B); 100 pA, 100 ms (D). E, plot of peak NMDAR-EPSC showing the effect of 8-OH-DPAT (20 μm) in the presence of α-Me-5HT (20 μm) and ketanserin (5-HT2A/C antagonist, 20 μm). F, cumulative data (mean ± S.E.) summarizing the percentage reduction of NMDAR-EPSC by 8-OH-DPAT in the presence or absence of various 5-HT receptor agonists or antagonists. *, p < 0.001, ANOVA.
FIGURE 2.
FIGURE 2.
Inhibition of 5-HT2A/C receptors unmasks the 5-HT1A -mediated reduction of NMDAR-EPSC in response to 5-HT. A, representative NMDAR-EPSC traces (average of three trials) showing the regulation of NMDAR-EPSC by 5-HT (10, 40, or 100 μm) in neurons treated with or without the 5-HT2A/C antagonist ketanserin (ket, 20 μm). Scale bars: 100 pA, 100 ms. B, dose-response curves summarizing the percentage reduction of NMDAR-EPSC by different concentrations of 5-HT in neurons treated with or without ketanserin. *, p < 0.001, ANOVA.
FIGURE 3.
FIGURE 3.
The synaptic NMDA response is reduced in PFC pyramidal neurons from animals with systemic administration of 5-HT1A agonist or the serotonin re-uptake inhibitor fluoxetine, which is opposed by injecting 5-HT2A/C agonist. A and B, dot plots showing the peak amplitude of NMDAR-EPSC recorded in PFC pyramidal neurons from animals with a single intraperitoneal injection of different drugs. A, saline, 8-OH-DPAT, α-Me-5HT, or 8-OH-DPAT plus α-Me-5HT; B, saline, fluoxetine, WAY-100635, WAY-100635 plus fluoxetine, ketanserin, or ketanserin plus fluoxetine. All drugs were at the concentration of 20 mg/kg. Animals were sacrificed for slicing 1 h after drug administration. Mean values of each group are indicated by short bars. Inset: representative NMDAR-EPSC traces recorded in PFC pyramidal neurons from animals with different drug injection. Scale bars: 100 pA, 100 ms. C, plot of normalized peak NMDAR-EPSC showing the effect of bath application of 8-OH-DPAT (40 μm) in PFC pyramidal neurons from animals intraperitoneally injected with fluoxetine (20 mg/kg) or saline.
FIGURE 4.
FIGURE 4.
Activation of 5-HT2A/C receptors attenuates the 5-HT1A -induced microtubule depolymerization and the effect of microtubule depolymerizer on NMDAR-EPSC. A, Western blot analysis of free tubulin in lysates of cultured PFC neurons treated with or without 8-OH-DPAT (40μm, 30 min) in the absence or presence of α-Me-5HT (20 μm, added 10 min before 8-OH-DPAT treatment). B, quantification of free tubulin assay. Free tubulin level was normalized to control (–), based on the intensity of the tubulin band from Western blot analyses. Each point represents mean ± S.E. of 4–5 independent experiments. *, p < 0.001, ANOVA. C, plot of normalized peak NMDAR-EPSC showing the effect of microtubule depolymerizer colchicine (30 μm) in the absence or presence of α-Me-5HT (20 μm). D, cumulative data (mean ± S.E.) illustrating the percent reduction of NMDAR-EPSC by colchicine in neurons with or without the exposure to α-Me-5HT. *, p < 0.05, ANOVA.
FIGURE 5.
FIGURE 5.
Activation of 5-HT2A/C receptors induces the phosphorylation and activation of ERK in neuronal dendrites in cultured PFC neurons. A and B, immunocytochemical images of cultured PFC neurons stained with phospho-ERK (A, green) or ERK (B, green) plus the nucleus marker TOPRO3 (red) in the absence (vehicle) or presence of α-Me-5HT (20 μm, 3 min) or glutamate (100 μm, 3 min).
FIGURE 6.
FIGURE 6.
The counteractive effect of 5-HT2A/C on 5-HT1A regulation of NMDAR function is dependent on the β-arrestin/ERK pathway. A, top: Western blots of β-arrestin 1/2 in PFC cultures transfected without or with siRNA against β-arrestin 1/2 or a scrambled siRNA. Quantification of β-arrestin 1/2 expression under different conditions. Each point represents mean ± S.E. of three independent experiments. *, p < 0.001, ANOVA. B, top: Western blots of phospho-ERK in the absence or presence of α-Me-5HT (20 μm, 3 min) in PFC cultures transfected with or without β-arrestin 1/2 siRNA. Bottom: quantification of phospho-ERK under different conditions. Each point represents mean ± S.E. of 4–5 independent experiments. *, p < 0.001, ANOVA. C, plot of peak NMDAR currents as a function of time and 8-OH-DPAT (20μm) application in the presence ofα-Me-5HT (20 μm) in GFP-positive neurons transfected with or without siRNA against β-arrestin 1/2. D, cumulative data (mean ± S.E.) summarizing the percentage reduction of NMDAR currents by 8-OH-DPAT in the absence or presence ofα-Me-5HT under different conditions. *, p < 0.001, ANOVA.
FIGURE 7.
FIGURE 7.
The counteractive effect of 5-HT2A/C on 5-HT1A regulation of NMDAR function involves clathrin/dynamin-mediated endocytosis. A, Western blots of phospho-ERK and total ERK in PFC cultures treated with or without α-Me-5HT (20 μm, 3 min) in the absence or presence of the cell-permeable (myristoylated) or non-permeable dynamin inhibitory peptide (both 50 μm), or a cell-permeable scrambled control peptide (50 μm). This scrambled peptide was fused with the protein transduction domain of the human immunodeficiency virus TAT protein (YGRKKRRQRRR, 53), which rendered it cell-permeable. All peptides were added 30 min before α-Me-5HT treatment. B, quantification of phospho-ERK under different conditions. Each point represents mean ± S.E. of 4–5 independent experiments. *, p < 0.001, ANOVA. C, plot of normalized peak NMDAR-EPSC showing the effect of 8-OH-DPAT (20 μm) in the presence of α-Me-5HT (20 μm) in cells dialyzed with the dynamin inhibitory peptide (50 μm) or a scrambled control peptide (50 μm). Inset, representative traces of NMDAR-EPSC taken at time points denoted by #. Scale bars: 100 pA, 10 ms. D, cumulative data (mean ± S.E.) summarizing the percentage reduction of NMDAR-EPSC by 8-OH-DPAT in the absence or presence of α-Me-5HT in neurons injected with or without the dynamin inhibitory peptide. *, p < 0.001, ANOVA.
FIGURE 8.
FIGURE 8.
Inhibition of Src prevents 5-HT2A/C from opposing 5-HT1A regulation of NMDAR currents. A, Western blots of phospho-ERK and total ERK in PFC cultures treated with or without α-Me-5HT (20 μm, 3 min) in the absence or presence of the Src kinase inhibitor PP2 or its inactive homolog PP3 (both 10 μm, added 30 min before α-Me-5HT treatment). B, quantification of phospho-ERK under different conditions. Each point represents mean ± S.E. of 4–5 independent experiments. *, p < 0.001, ANOVA. C, plot of normalized peak NMDAR-EPSC showing the effect of 8-OH-DPAT (20 μm) in the presence of α-Me-5HT (20 μm) in cells injected with PP2 (20 μm) or PP3 (20 μm). Inset, representative traces of NMDAR-EPSC (average of three trials) taken at time points denoted by #. Scalebars: 100 pA, 100 ms. D, cumulative data (mean ± S.E.) showing the percent reduction of NMDAR-EPSC by 8-OH-DPAT in the absence or presence of α-Me-5HT under different conditions. *, p < 0.001, ANOVA.
FIGURE 9.
FIGURE 9.
Activation of 5-HT2A/C receptors opposes the 5-HT1A -induced decrease of surface NR2B clusters on neuronal dendrites. A–F, immunocytochemical images of surface GFP-NR2B clusters in PFC cultures transfected with or withoutβ-arrestin2 siRNA. Cultures were untreated (control) or treated with 8-OH-DPAT (40 μm, 5 min) in the absence or presence of α-Me-5HT (20 μm, added 10 min before 8-OH-DPAT treatment). Enlarged versions of the boxed regions of dendrites are shown beneath each of the images. G, quantitative analysis of surface GFP-NR2B clusters (cluster density, size, and intensity) along dendrites under different treatments. *, p < 0.01, ANOVA.
FIGURE 10.
FIGURE 10.
The surface NMDAR level is reduced in PFC from fluoxetine-injected animals. A, Western blot analysis showing the surface and total NR1, NR2B, and GABAAR β2 subunits in lysates of PFC slices taken from animals receiving a single intraperitoneal injection of saline, fluoxetine, ketanserin, ketanserin plus fluoxetine, WAY-100635, or WAY-100635 plus fluoxetine (all drugs are 20 mg/kg). B, quantification of surface NMDAR subunits in PFC slices from animals treated with different drugs. *, p < 0.01; **, p < 0.001; ANOVA.

Similar articles

Cited by

References

    1. Buhot, M. C. (1997) Curr. Opin. Neurobiol. 7 243–254 - PubMed
    1. Andrade, R. (1998) Ann. N. Y. Acad. Sci. 861 190–203 - PubMed
    1. Martin, G. R., Eglen, R. M., Hamblin, M. W., Hoyer, D., and Yocca, F. (1998) Trends Pharmacol. Sci. 19 2–4 - PubMed
    1. Gross, C., Zhuang, X., Stark, K., Ramboz, S., Oosting, R., Kirby, L., Santarelli, L., Beck, S., and Hen, R. (2002) Nature 416 396–400 - PubMed
    1. Saudou, F., Amara, D. A., Dierich, A., LeMeur, M., Ramboz, S., Segu, L., Buhot, M. C., and Hen, R. (1994) Science 265 1875–1878 - PubMed

Publication types

LinkOut - more resources