

PVS: a web server for protein sequence variability analysis tuned to facilitate conserved epitope discovery
- PMID: 18442995
- PMCID: PMC2447719
- DOI: 10.1093/nar/gkn211
PVS: a web server for protein sequence variability analysis tuned to facilitate conserved epitope discovery
Abstract
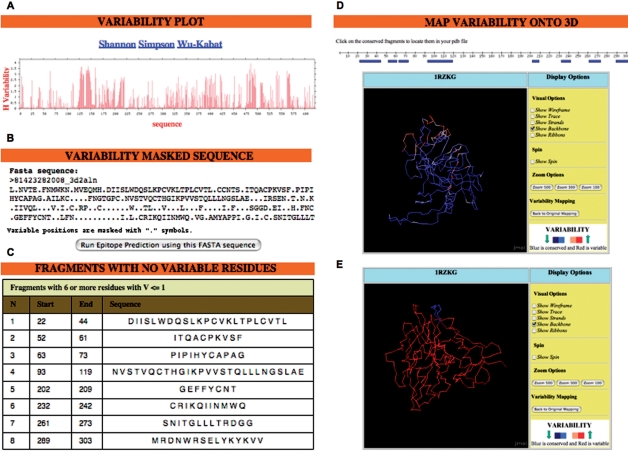
We have developed PVS (Protein Variability Server), a web-based tool that uses several variability metrics to compute the absolute site variability in multiple protein-sequence alignments (MSAs). The variability is then assigned to a user-selected reference sequence consisting of either the first sequence in the alignment or a consensus sequence. Subsequently, PVS performs tasks that are relevant for structure-function studies, such as plotting and visualizing the variability in a relevant 3D-structure. Neatly, PVS also implements some other tasks that are thought to facilitate the design of epitope discovery-driven vaccines against pathogens where sequence variability largely contributes to immune evasion. Thus, PVS can return the conserved fragments in the MSA-as defined by a user-provided variability threshold-and locate them in a relevant 3D-structure. Furthermore, PVS can return a variability-masked sequence, which can be directly submitted to the RANKPEP server for the prediction of conserved T-cell epitopes. PVS is freely available at: http://imed.med.ucm.es/PVS/.
Figures
Similar articles
-
BlockLogo: visualization of peptide and sequence motif conservation.J Immunol Methods. 2013 Dec 31;400-401:37-44. doi: 10.1016/j.jim.2013.08.014. Epub 2013 Aug 31. J Immunol Methods. 2013. PMID: 24001880 Free PMC article.
-
Generation of Variability-Free Reference Proteomes from Pathogenic Organisms for Epitope-Vaccine Design.Methods Mol Biol. 2020;2131:255-263. doi: 10.1007/978-1-0716-0389-5_13. Methods Mol Biol. 2020. PMID: 32162259
-
PROMALS3D web server for accurate multiple protein sequence and structure alignments.Nucleic Acids Res. 2008 Jul 1;36(Web Server issue):W30-4. doi: 10.1093/nar/gkn322. Epub 2008 May 24. Nucleic Acids Res. 2008. PMID: 18503087 Free PMC article.
-
BepiPred-2.0: improving sequence-based B-cell epitope prediction using conformational epitopes.Nucleic Acids Res. 2017 Jul 3;45(W1):W24-W29. doi: 10.1093/nar/gkx346. Nucleic Acids Res. 2017. PMID: 28472356 Free PMC article.
-
TreeDet: a web server to explore sequence space.Nucleic Acids Res. 2006 Jul 1;34(Web Server issue):W110-5. doi: 10.1093/nar/gkl203. Nucleic Acids Res. 2006. PMID: 16844971 Free PMC article.
Cited by
-
The N-terminal fragment of the tomato torrado virus RNA1-encoded polyprotein induces a hypersensitive response (HR)-like reaction in Nicotiana benthamiana.Arch Virol. 2016 Jul;161(7):1849-58. doi: 10.1007/s00705-016-2841-8. Epub 2016 Apr 13. Arch Virol. 2016. PMID: 27072852 Free PMC article.
-
Identification of highly conserved regions in L-segment of Crimean-Congo hemorrhagic fever virus and immunoinformatic prediction about potential novel vaccine.Adv Appl Bioinform Chem. 2015 Jan 8;8:1-10. doi: 10.2147/AABC.S75250. eCollection 2015. Adv Appl Bioinform Chem. 2015. PMID: 25609983 Free PMC article.
-
Differences in MHC-B diversity and KIR epitopes in two populations of wild chimpanzees.Immunogenetics. 2019 Nov;71(10):617-633. doi: 10.1007/s00251-019-01148-3. Epub 2019 Dec 3. Immunogenetics. 2019. PMID: 31797008 Free PMC article.
-
Genetic diversity, distribution, and evolution of chicken anemia virus: A comparative genomic and phylogenetic analysis.Front Microbiol. 2023 Mar 9;14:1145225. doi: 10.3389/fmicb.2023.1145225. eCollection 2023. Front Microbiol. 2023. PMID: 36970671 Free PMC article.
-
A novel approach to designing viral precision vaccines applied to SARS-CoV-2.Front Cell Infect Microbiol. 2024 Apr 2;14:1346349. doi: 10.3389/fcimb.2024.1346349. eCollection 2024. Front Cell Infect Microbiol. 2024. PMID: 38628551 Free PMC article.
References
-
- Kimura M. The Neutral Theory of Molecular Evolution. Cambridge, pp. 34–55: Cambridge University Press; 1983.
-
- del Sol Mesa A, Pazos F, Valencia A. Automatic methods for predicting functionally important residues. J. Mol. Biol. 2003;326:1289–1302. - PubMed
-
- Hannenhalli SS, Russell RB. Analysis and prediction of functional sub-types from protein sequence alignments. J. Mol. Biol. 2000;303:61–76. - PubMed
-
- Lichtarge O, Bourne HR, Cohen FE. An evolutionary trace method defines binding surfaces common to protein families. J. Mol. Biol. 1996;257:342–358. - PubMed
-
- Madabushi S, Yao H, Marsh M, Kristensen DM, Philippi A, Sowa ME, Lichtarge O. Structural clusters of evolutionary trace residues are statistically significant and common in proteins. J. Mol. Biol. 2002;316:139–154. - PubMed
Publication types
MeSH terms
Substances
LinkOut - more resources
Full Text Sources
Other Literature Sources
Research Materials
