. 2008 Jun;36(10):3374-88.
doi: 10.1093/nar/gkn108. Epub 2008 Apr 27.

A role for Caf1 in mRNA deadenylation and decay in trypanosomes and human cells

Affiliations

A role for Caf1 in mRNA deadenylation and decay in trypanosomes and human cells

Angela Schwede et al. Nucleic Acids Res. 2008 Jun.

Abstract

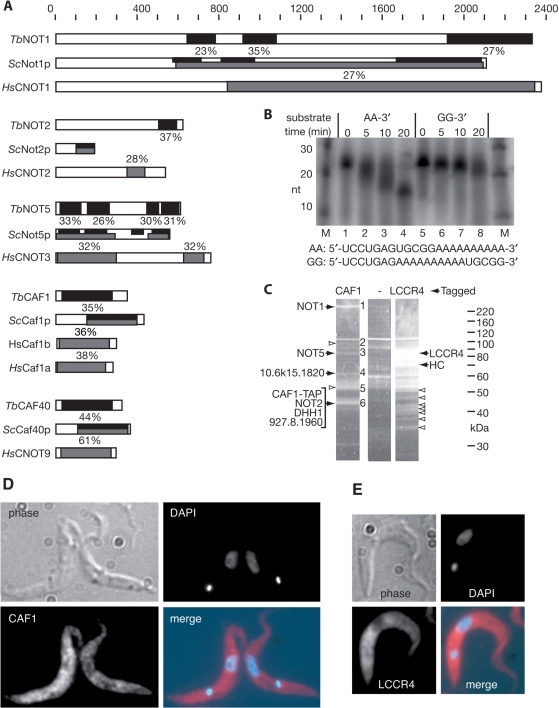
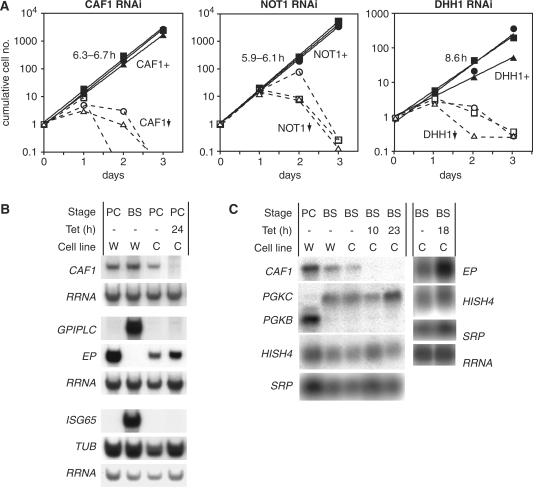
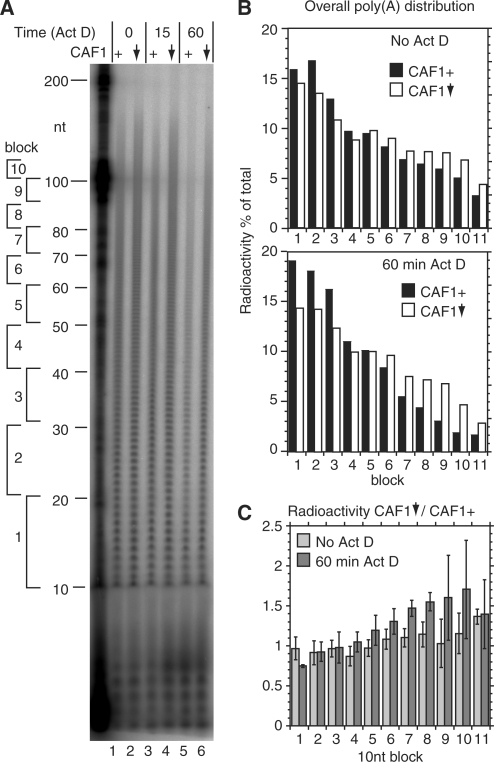
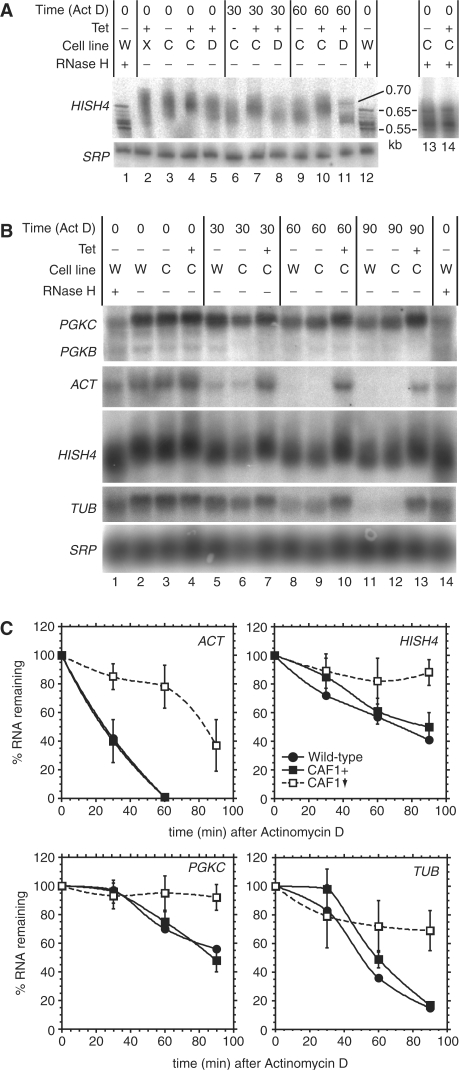
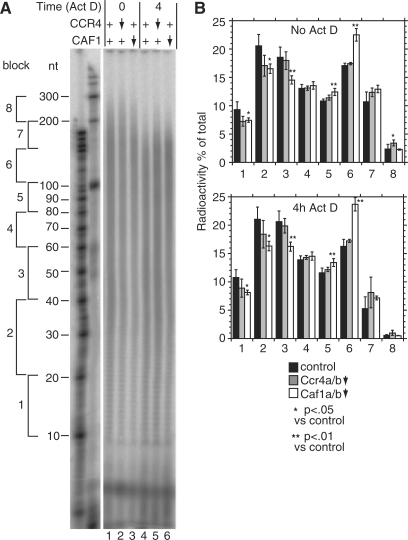
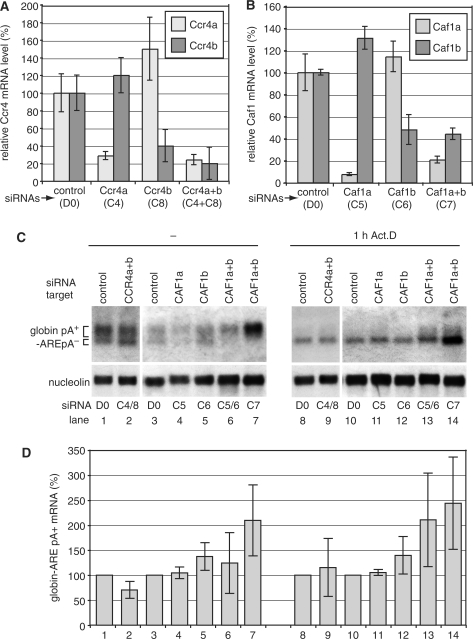
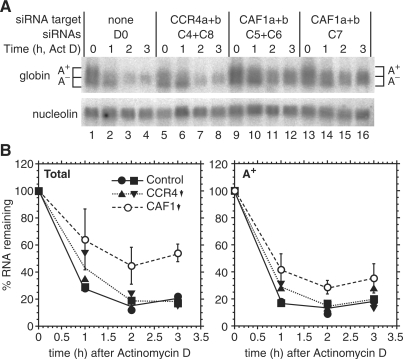
The eukaryotic Ccr4/Caf1/Not complex is involved in deadenylation of mRNAs. The Caf1 and Ccr4 subunits both potentially have deadenylating enzyme activity. We investigate here the roles of Ccr4 and Caf1 in deadenylation in two organisms that separated early in eukaryotic evolution: humans and trypanosomes. In Trypanosoma brucei, we found a complex containing CAF1, NOT1, NOT2 and NOT5, DHH1 and a possible homologue of Caf130; no homologue of Ccr4 was found. Trypanosome CAF1 has deadenylation activity, and is essential for cell survival. Depletion of trypanosome CAF1 delayed deadenylation and degradation of constitutively expressed mRNAs. Human cells have two isozymes of Caf1: simultaneous depletion of both inhibited degradation of an unstable reporter mRNA. In both species, depletion of Caf1 homologues inhibited deadenylation of bulk RNA and resulted in an increase in average poly(A) tail length.


Figures

Figure 1.
Figure 1.
(A) Diagrammatic representation of likely CAF1/NOT complex components from trypanosomes, aligned with the yeast and human homologues. The scale at the top represents amino acid residues. The black bars indicate regions of sequence similarity between the trypanosome and yeast proteins, and the percentage identical amino acids is shown, using output from GeneDB blastp using default settings. (The percentage similar amino acids was 1–5–2 times higher.) Grey bars similarly indicate the regions of sequence similarity between the human and yeast proteins, using the output of Blastp with NCBI database default settings. (B) Enzyme activity of recombinant TbCAF1. The oligonucleotides shown were 5′-radiolabelled; the samples without enzyme were incubated 20 min in buffer alone to exclude that the degradation observed was caused by contaminating RNases (lanes 1 and 5). Products were separated by denaturing gel electrophoresis. (C) Proteins associated with CAF1-TAP (left), CCR4L-TAP (right) or the TAP tag alone (centre) were subjected to purification on IgG and calmodulin columns, then separated by SDS–PAGE and stained with SyproRuby. The major potential complex components are indicated by solid arrows; other bands which were analysed and contained either tagged protein only, or highly abundant proteins which are probably contaminants are indicated by open arrows. Bands in the CAF1 lane are numbered on the right (identities in Table 3). HC: hypothetical protein conserved in all three trypanosomatids. (D) Location of TAP-tagged CAF1. Procyclic trypanosomes expressing CAF1-TAP were fixed and permeabilized, and the TAP tag was detected by immunofluorescence. The kinetoplast (small dot near the end of the parasite) and nuclear DNA (larger stain near the middle) were counter-stained with DAPI. A typical image is shown. Cells not expressing the TAP tag gave no fluorescence. (E) Location of TAP-tagged LCCR4. Details as for (D).
Figure 2.
Figure 2.
CAF1, DHH1 and NOT1 are essential for bloodstream trypanosome growth. (A) Trypanosomes were transfected with plasmids designed for tetracycline-inducible RNAi targeting CAF1, DHH1 or NOT1 and three independent cell lines were selected. Growth without tetracycline (filled symbols, continuous lines, CAF1+, NOT1+, DHH1+ cells) is illustrated as a cumulative exponential curve (log scale, initial number divided by 105) and the division time is indicated. Growth in the presence of tetracycline (added at time = 0) is shown using open symbols and dashed lines; the depletion of CAF1, DHH1 or NOT1 is indicated by the downward arrow. The three different symbols represent three different cell lines in each case. (B) Effect of CAF1 depletion on the levels of various RNAs in procyclic trypanosomes. The CAF1 mRNA was reduced to about 10% of normal after RNAi induction. Total glyoxal-treated RNA was separated on agarose gels, blotted and hybridized with the probes shown on the left. PC: procyclic; BS: bloodstream; tet: tetracycline. Cell lines are: W-cells expressing tet repressor and T7 polymerase; C-cells with inducible CAF1 RNAi. The experiments were performed in duplicate. Quantitation using the rRNA as a loading control revealed no reproducible effects of CAF1 depletion on any mRNA, apart from EP which increased 1.2–3.1-fold. (C) Effect of CAF1 depletion on the levels of various RNAs in bloodstream-form trypanosomes. Details as for (B) except that formaldehyde-agarose gels were used.
Figure 3.
Figure 3.
CAF1 depletion inhibits deadenylation in bloodstream trypanosomes. Total RNA was purified from cells with inducible CAF1 RNAi, cultured without tetracycline (CAF1+, lanes 1, 3 and 5) or with tetracycline (24 h) to deplete CAF1 (downward arrow, lanes 2, 4 and 6). Actinomycin D was then added for the times indicated. RNA was 3′-labelled then digested with RNases A and T1. (A) Phosphorimager image showing radiolabelled poly(A) tails separated by denaturing gel electrophoresis. To the left are the positions of markers. Further to the left we have indicated blocks of 10 a residues. Block 1 is the group from 11–20 As; block 2 from 21–30 As, and so on. (B) Quantitation of results from the gel shown in (A) (no Actinomycin and 60-min time point). For each lane, the amount of radioactivity in each block was plotted relative to the total radioactivity in the lane. Black bars: CAF1+; open bars: CAF1-depleted. (C) Results of three independent experiments, shown as arithmetic mean and standard deviation. We first generated data like that shown in (B) for all three experiments. We then divided the number for the CAF1-depleted cells by the number obtained for the CAF1+ cells. For block 1, the numbers are automatically 1. For blocks 2–11, numbers >1 indicate that the CAF1-depleted cells have more radioactivity in the poly(A) tails than do the normal cells. Here it is clear that the differences are stronger for the poly(A) tails above 70 nt, especially after Actinomycin D treatment.
Figure 4.
Figure 4.
CAF1 depletion inhibits degradation of ACT, PGKC, TUB and HISH4 mRNAs in trypanosomes. (A) Bloodstream trypanosomes expressing repressor alone (cell line W) or lines with inducible RNAi targeting XRNA (cell line X, lane 2), CAF1 (cell line C) or DHH1 (cell line D) were grown without (–) or with (+) tetracycline for 24 h as shown. Actinomycin D was then added for the times indicated (times include the centrifugation time). RNA was isolated and separated on a denaturing polyacrylamide gel. For lanes 1, 12, 13 and 14 the mRNA was treated with oligo d(T) and RNase H to remove the poly(A) tails. The histone H4 (HISH4) mRNA and the signal recognition particle RNA control (SRP) were detected after northern blotting. (B) As in (A), but separation on an agarose gel. RNA was detected using various probes, as indicated: PGKC: glycosomal phosphoglycerate kinase; ACT: actin; TUB: alpha tubulin; HISH4 (usually hybridized in that order, with intermediate stripping as required). (C) Results for three independent experiments [as in (B)] were quantitated, using SRP as the loading control, and results plotted as mean ± standard deviation (four experiments). Black circles: wild-type cells (two experiments only, arithmetic mean only shown); Black squares: inducible RNAi line without tetracycline (CAF1+); Open squares: inducible RNAi line with tetracycline (CAF1 down, with downward arrow).
Figure 5.
Figure 5.
CAF1 depletion inhibits deadenylation in human cells. HTGM5 cells were transfected with siRNAs to deplete CAF1 or CCR4 (downward arrow) or with control siRNAs (+). The effect of the siRNAs on their targets is illustrated in Figure 6. Samples were taken either with, or without 4 h Actinomycin D treatment. Purified RNA was 3′-labelled then digested with RNases A and T1. (A) Phosphorimager image showing radiolabelled poly(A) tails separated by denaturing gel electrophoresis. To the left are the positions of markers. Further to the left we have indicated blocks of 20–50 A residues, as in Figure 5. (B) Quantitation of results from the gel shown in (A). For each individual lane, the amount of radioactivity each block was calculated relative to the total radioactivity in the lane. The results are expressed as arithmetic mean ± standard deviation. Black bars: control siRNA, five independent experiments; grey bars: Ccr4a+b-depleted, siRNAs C4+C8, three experiments; open bars: Caf1a+b-depleted, siRNAs C5+C6, four experiments. Upper panel: steady state, values for lanes 1, 2 and 3 (in that order); lower panel: after 4 h Actinomycin D, values for lanes 4, 5 and 6. P-values are for a 2-tailed students t-test (unequal variance) and show the probability that the poly(A) tail signals for Ccr4- or Caf1-depleted cells were the same as those of the control.
Figure 6.
Figure 6.
Depletion of Caf1a and Caf1b inhibits deadenylation of an ARE-containing β-globin reporter mRNA in human cells. (A) HTGM5 cells were transfected over a period of 5 days with siRNAs targeting Ccr4a and Ccr4b; or (B) Caf1a and Caf1b. The knockdown efficiencies were measured at the mRNA expression level by quantitative PCR. The graphs show the mean and standard deviation from three assays in a single experiment; the siRNA transfection and the measurements were also repeated once (for Ccr4b) or three times (all other siRNAs) with very similar results. (C) Cytoplasmic RNA was prepared from siRNA-transfected cells with or without prior Actinomycin D treatment. Northern blots were hybridized with a globin probe (upper panel), and with a nucleolin probe as loading control (lower panel). (D) Quantitation of the poly(A)+ portion of globin-ARE mRNA shown in (C); mean and standard deviation from three (lanes 1, 2, 8 and 9) or four (lanes 3–7, 10–14) independent experiments.
Figure 7.
Figure 7.
Depletion of Caf1a and Caf1b inhibits degradation of the ARE-containing β-globin reporter mRNA. Transfection with siRNAs and RNA preparation was as for Figure 5, except that samples were taken 1, 2 and 3 h after addition of Actinomycin D. The experiment was done twice with similar results. (A) Northern blot for the first experiment. To quantitate the globin mRNA, the lower portion of the globin signal in lane 1 was designated as poly(A); the upper portion, which had the same area as the lower one, was designated poly(A)+ as indicated. Identical areas were then used for all of the other lanes, aligning the bottom of the quantitation box just beneath the signal in each case. (B) Quantitation for both experiments. Results for the control and Ccr4a+b knockdown are shown separately, as indicated in the legend within the graph; the lines are drawn through the arithmetic mean. Results for the siRNAs C5+6 and C7 (CAF1 RNAi) were indistinguishable. These results were therefore pooled, to generate a mean and standard deviation from a total of four measurements (2× C5+6 plus 2× C7).

Similar articles

Cited by

References

    1. Parker R, Song H. The enzymes and control of eukaryotic mRNA turnover. Nat. Struct. Mol. Biol. 2004;11:121–127. - PubMed
    1. Chen CY, Xu N, Shyu AB. mRNA decay mediated by two distinct AU-rich elements from c-fos and granulocyte-macrophage colony-stimulating factor transcripts: different deadenylation kinetics and uncoupling from translation. Mol. Cell. Biol. 1995;15:5777–5788. - PMC - PubMed
    1. Chen J, Chiang Y.-C, Denis CL. CCR4, a 3′-5′ poly(A) RNA and ssDNA exonuclease, is the catalytic component of the cytoplasmic deadenylase. EMBO J. 2002;21:1414–1426. - PMC - PubMed
    1. Tucker M, Staples RR, Valencis-Sanchez MA, Muhlrad D, Parker R. Ccr4p is the catalytic subunit of a Ccr4p/Pop2p/Notp mRNA deadenylase complex in Saccharomyces cerevisiae. EMBO J. 2002;21:1427–1436. - PMC - PubMed
    1. Tucker M, Valencia-Sanchez MA, Staples RR, Chen J, Denis CL, Parker R. The transcription factor associated Ccr4 and Caf1 proteins are components of the major cytoplasmic mRNA deadenylase in Saccharomyces cerevisiae. Cell. 2001;104:377–386. - PubMed

Publication types

MeSH terms