. 2008 Jul;76(7):3293-303.
doi: 10.1128/IAI.00365-08. Epub 2008 Apr 28.

Cholesterol depletion reduces Helicobacter pylori CagA translocation and CagA-induced responses in AGS cells

Affiliations

Cholesterol depletion reduces Helicobacter pylori CagA translocation and CagA-induced responses in AGS cells

Chih-Ho Lai et al. Infect Immun. 2008 Jul.

Abstract

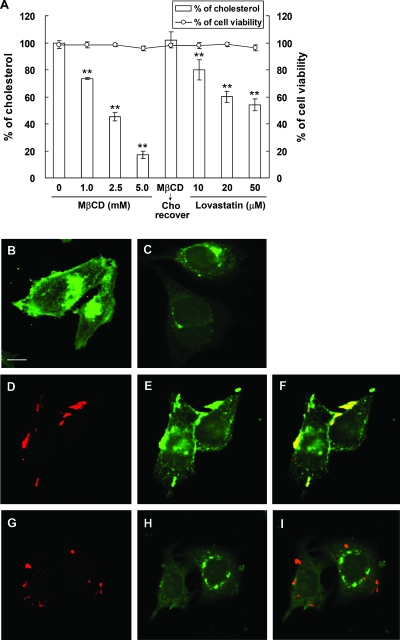
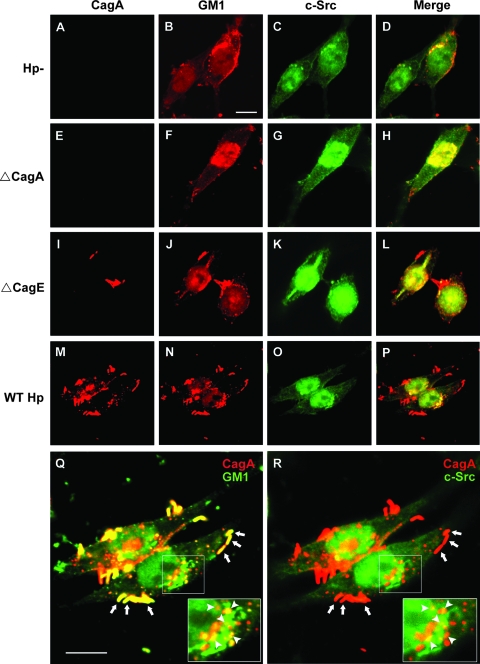
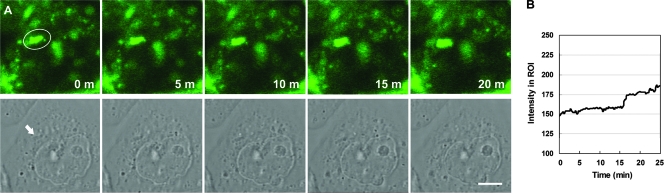
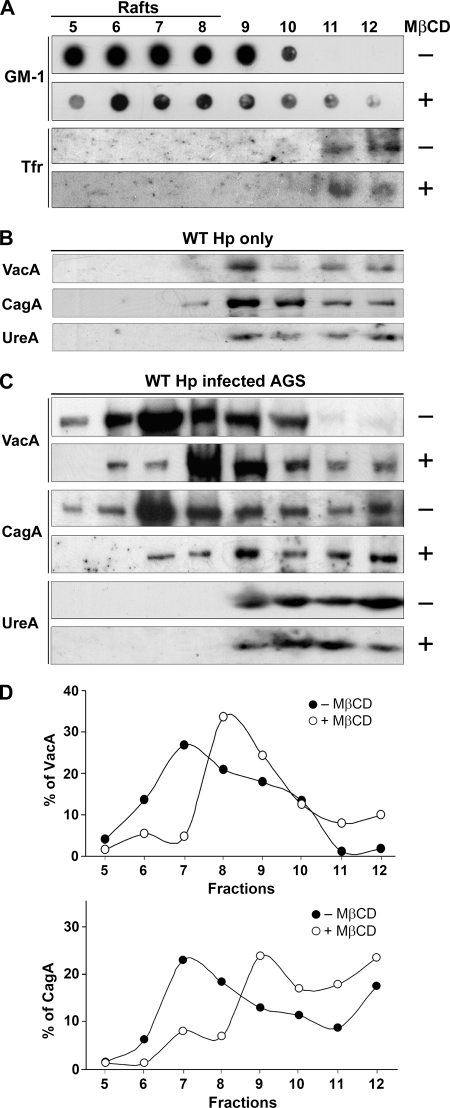
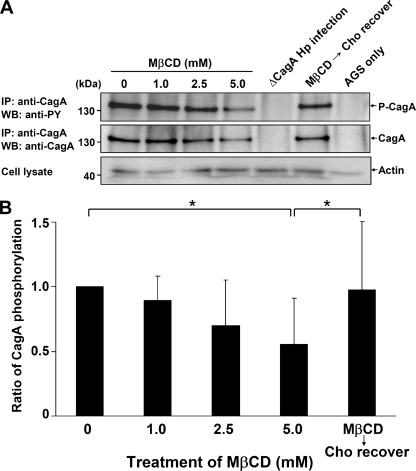
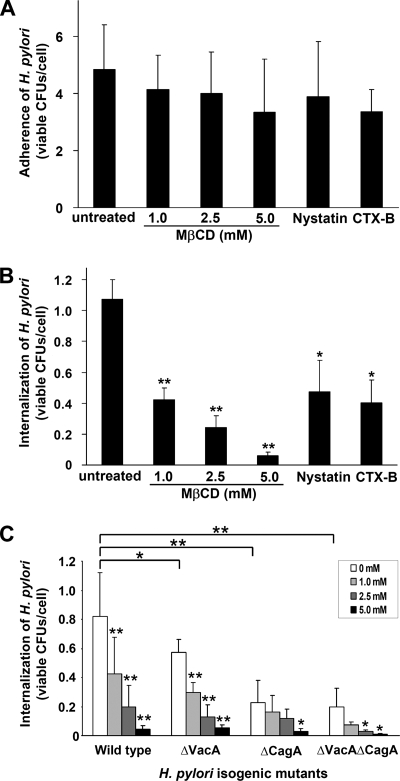
Infection with Helicobacter pylori cagA-positive strains is associated with gastritis, ulcerations, and gastric cancer. CagA is translocated into infected epithelial cells by a type IV secretion system and can be tyrosine phosphorylated, inducing signal transduction and motogenic responses in epithelial cells. Cellular cholesterol, a vital component of the membrane, contributes to membrane dynamics and functions and is important in VacA intoxication and phagocyte evasion during H. pylori infection. In this investigation, we showed that cholesterol extraction by methyl-beta-cyclodextrin reduced the level of CagA translocation and phosphorylation. Confocal microscope visualization revealed that a significant portion of translocated CagA was colocalized with the raft marker GM1 and c-Src during infection. Moreover, GM1 was rapidly recruited into sites of bacterial attachment by live-cell imaging analysis. CagA and VacA were cofractionated with detergent-resistant membranes (DRMs), suggesting that the distribution of CagA and VacA is associated with rafts in infected cells. Upon cholesterol depletion, the distribution shifted to non-DRMs. Accordingly, the CagA-induced hummingbird phenotype and interleukin-8 induction were blocked by cholesterol depletion. Raft-disrupting agents did not influence bacterial adherence but did significantly reduce internalization activity in AGS cells. Together, these results suggest that delivery of CagA into epithelial cells by the bacterial type IV secretion system is mediated in a cholesterol-dependent manner.


Figures

FIG. 1.
FIG. 1.
The level of cellular cholesterol and GM1 was reduced when AGS cells were treated with MβCD or lovastatin. (A) Cholesterol levels of AGS cells treated with MβCD or lovastatin. AGS cells were treated as follows: (i) with various concentrations of MβCD (0, 1.0, 2.5, and 5.0 mM), (ii) with 5.0 mM MβCD and cholesterol (400 μg/ml) replenishment, and (iii) with various concentrations of lovastatin (10, 20, and 50 μM). Cells were then harvested for cholesterol detection (bars). The cell viability was hardly influenced under these conditions, as determined by the exclusion of trypan blue. The data are the means ± standard deviations from at least triplicate independent experiments. Two asterisks indicate that the P value was <0.01 compared to untreated controls, as determined by Student's t test. (B to I) Confocal microscopic analysis of noninfected and infected AGS cells. Cells that were not treated (B) or were treated with MβCD (C) were stained with FITC-conjugated CTX-B to visualize GM1. For infection experiments, untreated cells (D to F) or MβCD-treated cells (G to I) were infected with H. pylori strain 26695 (MOI, 50) at 37°C for 6 h. Infected cells were fixed and then probed with specific markers for BabA (red) (D and G) and GM1 (green) (E and H). Yellow in the merged images indicates colocalization (F and I). Scale bar, 10 μm.
FIG. 2.
FIG. 2.
Distribution of adhered bacteria, translocated CagA, GM1, and c-Src in infected AGS cells. Untreated AGS cells (A to D), ΔCagA-infected cells (E to H), ΔCagE-infected cells (I to L), and wild-type H. pylori-infected cells (M to P) were fixed and stained with goat anti-CagA, rabbit anti-c-Src, and Alexa Fluor 555-conjugated CTX-B to visualize GM1, followed by Cy5-conjugated anti-goat and FITC-conjugated anti-rabbit antibodies. Red, CagA; pseudored, GM1; green, c-Src. Yellow in the merged images (D, H, L, and P) indicates colocalization of GM1 and c-Src. (M to R) AGS cells were cocultured with wild-type H. pylori at 37°C for 6 h and then fixed and stained, and this was followed by observation by confocal fluorescence microscopy as described above. For two merged images (panels Q [CagA and GM1] and R [CagA and c-Src]), the framed region was magnified, and the magnified images are shown in the lower right corner. Areas of colocalization of CagA and GM1 (Q) or CagA and c-Src (R) in the cell (right) are indicated by arrowheads. The adhered H. pylori bacteria in the cell (right) are indicated by arrows. Scale bars, 10 μm. Hp−, not treated with H. pylori; WT Hp, treated with wild-type H. pylori.
FIG. 3.
FIG. 3.
GM1 is specifically recruited to the site of H. pylori attachment. (A) AGS cells were plated on coverslips, probed with FITC-conjugated CTX-B to visualize GM1, and then infected with H. pylori as described in Materials and Methods. Infected live cells were visualized using a Zeiss LSM510 META confocal laser scanning microscope for time-lapse experiments. Images were taken in 15-s series for a total of 25 min. Confocal images (488 nm) taken at different time points are shown in the top panels, while the corresponding phase-contrast images are shown in the bottom panels. The ellipse indicates an ROI, and the arrow indicates a bacterium attached to the cell. Scale bar, 5 μm. (B) The fluorescence intensity in the ROI was evaluated for all images.
FIG. 4.
FIG. 4.
The distribution of CagA and VacA in infected cells shifted from DRMs to non-DRMs upon cholesterol depletion. (A) Infected AGS cells were subjected to fractionation in an Optiprep density gradient at 4°C. Each fraction was assayed for GM1 with HRP-conjugated CTX-B using dot blot analysis and was assayed for the transferrin receptor with anti-Tfr antibody using Western blot analysis. (B) Pure bacteria were subjected to fractionation in an Optiprep density gradient at 4°C. Each fraction was assayed for VacA, CagA, and UreA using Western blot analysis. (C) AGS cells were infected with H. pylori 26695, which was followed by fractionation in an Optiprep density gradient at 4°C. For cholesterol depletion, cells were treated with 5.0 mM MβCD for 1 h prior to incubation. Each fraction was assayed for VacA, CagA, and UreA using Western blot analysis. (D) VacA (upper panel) and CagA (lower panel) signals in each fraction from panel C were detected and expressed as relative intensities. WT Hp, wild-type H. pylori.
FIG. 5.
FIG. 5.
Sufficient cellular cholesterol was essential for H. pylori CagA translocation and phosphorylation. (A) AGS cells were pretreated as follows: (i) treated with various concentrations of MβCD (0, 1.0, 2.5, and 5.0 mM) and (ii) treated with 5.0 mM MβCD and replenished with cholesterol (400 μg/ml). Cells were then infected with the H. pylori 26695 wild type or ΔCagA mutant. Whole-cell lysates were immunoprecipitated for CagA, and the immunoprecipitates were subjected to Western blot analysis. Tyrosine-phosphorylated CagA was probed using mouse anti-phosphotyrosine antibody (4G10), and CagA was probed using mouse anti-CagA. Actin from whole-cell lysates was detected by using goat anti-actin antibody to ensure equal loading. (B) The level of CagA phosphorylation was evaluated by densitometric analysis. The values are means and standard deviations of four independent experiments. Statistical significance was evaluated using the paired t test (asterisk, P < 0.05). Hp, H. pylori; IP, immunoprecipitation; WB, Western blotting; Cho, cholesterol; anti-PY, anti-phosphotyrosine antibody.
FIG. 6.
FIG. 6.
The level of cellular cholesterol influenced the CagA-induced responses of infected AGS cells. (A) The hummingbird phenotype of infected AGS cells induced by CagA was blocked by cholesterol depletion. AGS cells were pretreated with or without MβCD, which was followed by infection with wild-type H. pylori or the ΔCagA mutant, and then viewed by phase-contrast microscopy. MβCD−, without MβCD treatment; MβCD+, with 5.0 mM MβCD treatment; Cho recover+, MβCD-treated cells that were replenished with 400 μg/ml cholesterol for 1 h; WT Hp+, cells infected by wild-type H. pylori; Hp−, noninfected cells; ΔCagA+, cells infected by H. pylori ΔCagA. In each experiment, AGS cells were added to mid-logarithmic-phase bacteria at a synchronized MOI of 100 and incubated at 37°C for 6 h. Scale bar, 20 μm. (B) The proportion of elongated cells was determined from the results shown in panel A. Cho, cholesterol; Hp, H. pylori; WT, wild type. (C) Induction of IL-8 involves CagA and host cellular cholesterol. AGS cells were treated with lovastatin (0, 10, 20, and 50 μM) and infected with wild-type H. pylori (filled bars) or the ΔCagA mutant (open bars). After 6 h of infection, the level of IL-8 in the culture supernatant was determined by a standard ELISA method. The data are the means and standard deviations of at least three independent experiments. Statistical significance was evaluated using Student's t test (one asterisk, P < 0.05; two asterisks, P < 0.01; n.s., not significant).
FIG. 7.
FIG. 7.
H. pylori internalization rather than adherence to AGS cells is influenced by raft-disrupting agents. (A) Adherence of H. pylori to AGS cells was not blocked by pretreatment with MβCD, nystatin (50 μg/ml), or CTX-B (20 μg/ml). (B) Internalization of H. pylori in AGS cells was influenced by pretreatment with MβCD, nystatin (50 μg/ml), or CTX-B (20 μg/ml). (C) Surface virulence factors CagA and VacA were involved in the in vitro internalization assay. AGS cells were not treated or pretreated with MβCD (1.0, 2.5, and 5.0 mM) and then infected with wild-type H. pylori and isogenic mutants (ΔVacA, ΔCagA, and ΔVacAΔCagA). The viable bacterial uptake shown in panels B and C was determined by an in vitro gentamicin assay. The results are expressed as the number of viable CFU per cell, and the values are the means and standard deviations of at least six independent experiments. Statistical significance was calculated using Student's t test and compared to the untreated cells in panels A and B. In panel C, statistical significance was calculated for each isogenic mutant by comparison to wild-type H. pylori. A statistical evaluation of the internalization activity for infected cells before and after MβCD treatment was performed for the wild-type, ΔVacA, ΔCagA, and ΔVacAΔCagA strains. One asterisk, P < 0.05; two asterisks, P < 0.01.

Similar articles

Cited by

References

    1. Abrami, L., and F. G. van Der Goot. 1999. Plasma membrane microdomains act as concentration platforms to facilitate intoxication by aerolysin. J. Cell Biol. 147175-184. - PMC - PubMed
    1. Alm, R. A., and T. J. Trust. 1999. Analysis of the genetic diversity of Helicobacter pylori: the tale of two genomes. J. Mol. Med. 77834-846. - PubMed
    1. Amieva, M. R., N. R. Salama, L. S. Tompkins, and S. Falkow. 2002. Helicobacter pylori enter and survive within multivesicular vacuoles of epithelial cells. Cell. Microbiol. 4677-690. - PubMed
    1. Anderson, H. A., Y. Chen, and L. C. Norkin. 1996. Bound simian virus 40 translocates to caveolin-enriched membrane domains, and its entry is inhibited by drugs that selectively disrupt caveolae. Mol. Biol. Cell 71825-1834. - PMC - PubMed
    1. Asahi, M., Y. Tanaka, T. Izumi, Y. Ito, H. Naiki, D. Kersulyte, K. Tsujikawa, M. Saito, K. Sada, S. Yanagi, A. Fujikawa, M. Noda, and Y. Itokawa. 2003. Helicobacter pylori CagA containing ITAM-like sequences localized to lipid rafts negatively regulates VacA-induced signaling in vivo. Helicobacter 81-14. - PubMed

Publication types

MeSH terms