. 2008 Jul;76(7):3221-32.
doi: 10.1128/IAI.01677-07. Epub 2008 Apr 28.

Effect of multiple genetic polymorphisms on antigen presentation and susceptibility to Mycobacterium tuberculosis infection

Affiliations

Effect of multiple genetic polymorphisms on antigen presentation and susceptibility to Mycobacterium tuberculosis infection

Stewart T Chang et al. Infect Immun. 2008 Jul.

Abstract

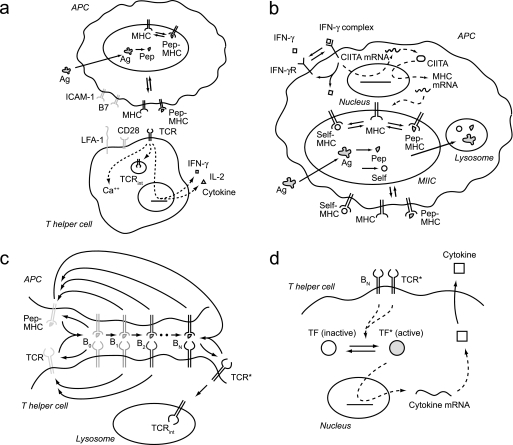
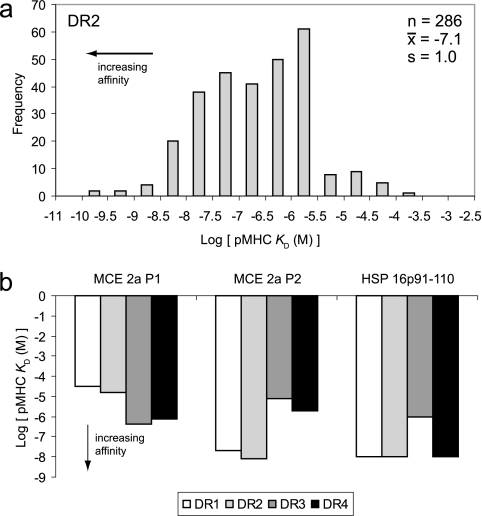
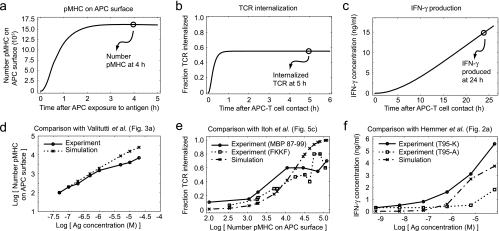
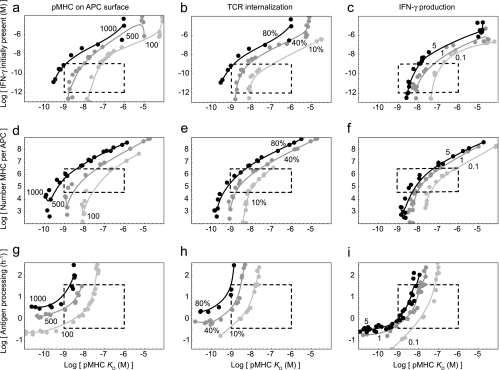
Several molecules related to antigen presentation, including gamma interferon (IFN-gamma) and the major histocompatibility complex (MHC), are encoded by polymorphic genes. Some polymorphisms were found to affect susceptibility to tuberculosis (TB) when they were considered singly in epidemiological studies, but how multiple polymorphisms interact to determine susceptibility to TB in an individual remains an open question. We hypothesized that polymorphisms in some genes may counteract or intensify the effects of polymorphisms in other genes. For example, an increase in IFN-gamma expression may counteract the weak binding that a particular MHC variant displays for a peptide from Mycobacterium tuberculosis to establish the same T-cell response as another, more strongly binding MHC variant. To test this hypothesis, we developed a mathematical model of antigen presentation based on experimental data for the known effects of genetic polymorphisms and simulated time courses when multiple polymorphisms were present. We found that polymorphisms in different genes could affect antigen presentation to the same extent and therefore compensate for each other. Furthermore, we defined the conditions under which such relationships could exist. For example, increased IFN-gamma expression compensated for decreased peptide-MHC affinity in the model only above a certain threshold of expression. Below this threshold, changes in IFN-gamma expression were ineffectual compared to changes in peptide-MHC affinity. The finding that polymorphisms exhibit such relationships could explain discrepancies in the epidemiological literature, where some polymorphisms have been inconsistently associated with susceptibility to TB. Furthermore, the model allows polymorphisms to be ranked by effect, providing a new tool for designing association studies.


Figures

FIG. 1.
FIG. 1.
Schematic diagram of the multiscale model of antigen presentation. (a) Overview of antigen presentation by APCs and the T-cell response. (b) APC model (input, IFN-γ, exogenous antigen; output, surface pMHCs). (c) T-cell model (input, surface pMHCs from APC model; outputs, activated TCRs and internalized TCRs). (d) Cytokine production model (input, activated TCRs; output, cytokines, particularly IFN-γ). Abbreviations: Ag, antigen; Pep, exogenous peptide; Self, self peptide; B with subscripts 0 through N, pMHC-TCR complexes in different stages of activation; TF, transcription factor; IL-2, interleukin-2. Direct, mechanistic reactions in the model are indicated by solid arrows, while indirect, regulatory interactions in the model are indicated by dashed arrows. The names of cellular compartments are italicized.
FIG. 2.
FIG. 2.
Experimentally quantified effects of MHC polymorphisms on peptide-binding affinities. (a) Survey of pMHC affinities involving HLA-DR1 as found in the IEDB (49). n, number of peptides; x̄, mean value; s, standard deviation. (b) Affinities of different MHC molecules for a common set of M. tuberculosis peptides. MCE 2a P1 and MCE 2a P2 refer to M. tuberculosis MCE family protein MCE 2 peptides P1 and P2 (47), respectively, and HSP 16p91-110 refers to a peptide comprising amino acids 91 to 110 from M. tuberculosis heat shock protein 16.3 (26).
FIG. 3.
FIG. 3.
Comparison of multiscale model predictions with experimental data. (a) Time course for the number of pMHCs on the APC surface in the model. (b) Time course for TCR internalization in T cells in the model. (c) Time course for IFN-γ production in the model. (d) Dose-response curve for pMHCs as the antigen concentration is varied in the model, along with experimental data. (e) Dose-response curve for TCR internalization as the number of pMHCs on the APC surface is varied in the model, along with experimental data. (f) Dose-response curve for IFN-γ production as the antigen concentration is varied in the model, along with experimental data. When more than one curve was available from the experimental data (e and f), the highest and lowest nonzero experimental curves were selected and are shown. Model parameter values are provided in the supplemental material. Ag, antigen.
FIG. 4.
FIG. 4.
Trade-off plots showing that polymorphisms in different genes affecting APCs may compensate for deficiencies in pMHC binding to maintain a given response. Values for pairs of parameters were varied, and pairs resulting in the same target output value were plotted. (a to c) IFN-γ expression (expressed as the amount initially available to APCs) versus pMHC binding. (d to f) MHC expression versus pMHC binding. (g to i) Antigen processing versus pMHC binding. The target output values were 100, 500, or 1,000 pMHCs on the APC surface; 10, 40, or 80% internalization of total TCRs; and production of 0.1, 1, or 5 pM IFN-γ, corresponding to ∼2, ∼20, and ∼200 pg/ml IFN-γ. Dashed boxes indicate biologically plausible values (see Materials and Methods). Model parameter values are provided in the supplemental material.
FIG. 5.
FIG. 5.
Trade-off plots showing that polymorphisms in different genes affecting a T cell may compensate for deficiencies in pMHC binding to maintain a given response. (a to c) Plots of pMHC-TCR affinity versus pMHC affinity, showing that an optimal value for one parameter (in this case pMHC-TCR affinity) appears as a peak on such plots. (d to f) Plots of the internalization rate constant for free, activated TCRs versus pMHC affinity, showing that parameters may affect two outputs differently, resulting in curves with different slopes. The target output values were 100, 500, or 1,000 pMHCs on the APC surface; 10, 40, or 80% internalization of the total TCRs; and production of 0.1, 1, or 5 pM IFN-γ, corresponding to ∼2, ∼20, and ∼200 pg/ml IFN-γ. Dashed boxes indicate biologically plausible values (see Materials and Methods). Model parameter values are provided in the supplemental material.
FIG. 6.
FIG. 6.
Conceptualized multidimensional trade-off plot showing how the host and pathogen may respond to each other during the course of an infection. The gray area represents all parameters that lead to a threshold number of pMHCs on the APC surface or a corresponding T-cell response. Points represent values measured for the three parameters at different time points during an infection, with the points above and below the surface representing successful and unsuccessful immune responses, respectively. Ag, antigen.

Similar articles

Cited by

References

    1. Agrawal, N. G., and J. J. Linderman. 1996. Mathematical modeling of helper T lymphocyte/antigen-presenting cell interactions: analysis of methods for modifying antigen processing and presentation. J. Theor. Biol. 182487-504. - PubMed
    1. Alcais, A., N. Remus, L. Abel, and J. L. Casanova. 2001. Genetic susceptibility to tuberculosis: from monogenic to polygenic inheritance. Sepsis 4237-246.
    1. Bellamy, R. 2005. Genetic susceptibility to tuberculosis. Clin. Chest Med. 26233-246. - PubMed
    1. Bland, J. M., and D. G. Altman. 1995. Multiple significance tests: the Bonferroni method. BMJ 310170. - PMC - PubMed
    1. Blower, S. M., and H. Dowlatabadi. 1994. Sensitivity and uncertainty analysis of complex models of disease transmission: an HIV model, as an example. Int. Stat. Rev. 2229-243.

Publication types

MeSH terms

Substances