. 2008 May 5;181(3):551-65.
doi: 10.1083/jcb.200711002. Epub 2008 Apr 28.

Prion protein attenuates excitotoxicity by inhibiting NMDA receptors

Affiliations

Prion protein attenuates excitotoxicity by inhibiting NMDA receptors

Houman Khosravani et al. J Cell Biol. .

Erratum in

  • J Cell Biol. 2009 Jun 15;185(6):1127

Abstract

It is well established that misfolded forms of cellular prion protein (PrP [PrP(C)]) are crucial in the genesis and progression of transmissible spongiform encephalitis, whereas the function of native PrP(C) remains incompletely understood. To determine the physiological role of PrP(C), we examine the neurophysiological properties of hippocampal neurons isolated from PrP-null mice. We show that PrP-null mouse neurons exhibit enhanced and drastically prolonged N-methyl-d-aspartate (NMDA)-evoked currents as a result of a functional upregulation of NMDA receptors (NMDARs) containing NR2D subunits. These effects are phenocopied by RNA interference and are rescued upon the overexpression of exogenous PrP(C). The enhanced NMDAR activity results in an increase in neuronal excitability as well as enhanced glutamate excitotoxicity both in vitro and in vivo. Thus, native PrP(C) mediates an important neuroprotective role by virtue of its ability to inhibit NR2D subunits.


Figures
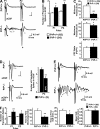
Figure 1.
Figure 1.
Field potentials recorded in the CA1 layer of hippocampal slices from WT and PrP-null mice. (A) Paired pulses evoked by stimulation of the Schaffer collaterals in slices from P30–45 mice in normal artificial cerebrospinal fluid (aCSF). (B) Quantification of the number of population spikes in WT and PrP-null slices in aCSF. (C, top) Minimum stimulus intensity required to evoke a single population spike in WT and PrP-null slices. (middle) Stimulus intensity required to evoke maximum single population spike amplitude. (bottom) Extent of paired pulse facilitation in WT and PrP-null slices. (D, top) Field potentials recorded from PrP-null slices before and after the application of 50 μM APV as shown for P2. (bottom) Quantification of the number of population spikes before and after APV application in PrP-null slices. (E) Evoked field potentials recorded after 5 min of perfusion in zero-magnesium aCSF (ZM-aCSF). The gray arrows indicate successive population spikes, which are augmented in the PrP-null slices. (F, left) The number of population spikes overriding the fEPSP in slices exposed to ZM-aCSF. (second graph) Time to the observance of the first seizurelike discharge in ZM-aCSF. (third graph) Time to the occurrence of the first seizurelike event (SLE) upon perfusion with ZM-aCSF. (right) Duration of seizurelike events in WT and PrP-null slices. The black and gray arrowheads indicate the primary population spikes and the additional population spikes, respectively, overriding the fEPSP in each pulse (P1 and P2); these latter polyspikes were only observed in PrP-null mice. Data are represented as mean ± SEM (error bars) with statistical significance denoted as *, P < 0.05 and **, P < 0.001. Numbers in parentheses indicate the number of slices.
Figure 2.
Figure 2.
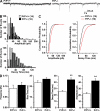
Analysis of miniature synaptic NMDAR currents in cultured hippocampal neurons from WT and PrP-null mice. (A) Representative examples of raw mEPSCs recorded in mature (12–16 DIV) WT and PrP-null hippocampal neurons in culture. In PrP-null neurons, NMDA-mediated mEPSCs were observed to be larger and showed prolonged decay times. (B) Event histograms for mEPSC amplitude (top) and decay time (bottom). Note that mEPSCs in PrP-null neurons exhibit a shift toward larger amplitude events and increased decay time constants. (C) Cumulative probability plots for mEPSC amplitude and decay times showing a shift in each summed distribution toward larger events with longer decay times (P < 0.05; Kolmogorov-Smirnov test). (D) Mean values for mEPSC waveform parameters showing increased EPSC amplitudes and prolonged decay times. Here, decay time refers to the time required for an e-fold reduction in peak current amplitude. Data are represented as mean ± SEM (error bars), with statistical significance denoted as *, P < 0.05 and **, P < 0.001. Numbers in parentheses indicate the number of cells.
Figure 3.
Figure 3.
Kinetic analysis of evoked NMDAR-mediated currents in cultured hippocampal neurons from WT and PrP-null mice. (A) Representative NMDAR-mediated currents in response to 100-μM transient NMDA puff application at 50- and 100-ms durations for WT (black) and PrP-null (red) neurons. Note the prolonged decay kinetics in the PrP-null neurons. The records were arbitrarily scaled to overlap at peak. (B) Time to 50% decay (i.e., the time required for decay to half-maximum peak current amplitude) for WT and PrP-null neurons. (C) Current amplitudes evoked by 50- and 100-ms puffs of NMDA for WT and Prp-null neurons. (D, left) Cultured WT mouse hippocampal neurons cotransfected with YFP and siRNA against PrPC and permeabilized and stained with a PrPC antibody. Note that the YFP-positive (i.e., siRNA transfected) cell is negative for PrPC, whereas a YFP-negative cell in the same dish shows robust PrP expression. The arrowheads indicate the location of the soma. (E) Time to 50% decay for WT neurons transfected with siRNA against PrP for an NMDA puff duration of 100 ms. Data were compared with culture-matched neurons transfected with YFP alone or nearby untransfected (UT) cells within the same siRNA-transfected culture. (F) Time to 50% decay for PrP-null neurons transfected with PrP cDNA plus a YFP marker. Currents were evoked with a 100-ms puff of NMDA. Data were compared with culture-matched YFP alone or untransfected cells. Data are represented as mean ± SEM (error bars), with statistical significance denoted as *, P < 0.05 and **, P < 0.001. Numbers in parentheses indicate the number of cells. Bar, 30 μm.
Figure 4.
Figure 4.
Analysis of the NMDAR NR2D subunit distribution. (A) Western blot analysis of the NR2D subunit protein expression in neonatal and adult hippocampal tissue obtained from the WT and PrP-null mouse. α-Actin expression was used as a loading control. (B) NMDAR subunit surface expression as visualized by immunolabel reactivity with an antibody targeted against an extracellular (N terminus) epitope of NR2D. A punctate pattern of receptor distribution is visualized along dendritic processes. The depth of field is ∼1 μm. (C) Surface expression of NR2D relative to total cellular NR2D protein content as quantified using an ELISA assay in permeabilized (P) and nonpermeabilized (NP) cells. The number of neuronal culture samples is indicated in parentheses. Error bars represent SEM. (D) Coimmunoprecipitation of PrPC and NR2D using both permutations of tag and probe showing that PrP and NR2D are in a complex. In the top panel, the blot was probed with a PrP antibody, and in the bottom panel, membrane was probed with NR2D antibody. The lane labeled control reflects beads without antibody. The experiment is a representative example of four different repetitions for both neonatal and adult mouse hippocampal tissue. (E) Western blot demonstrating the lack of coimmunoprecipitation between NR2B and PrPC, whereas NR2B can be detected in brain homogenate (input). (F) Costaining of WT mouse hippocampal neurons for PrPC (red) and NR2D (blue). The cells were not permeabilized, thus allowing for the selective staining of cell surface protein. The white line in the top left panel indicates the position of the linescan shown in the bottom left panel. The rectangle in the merged image (top right) corresponds to the magnified images shown at the bottom right. The arrowheads highlight examples of clear colocalization between NR2D and PrPC. Bars: (B, top left) 7.5 μm; (B, top right and F, top) 10 μm; (B, bottom) 1 μm; (F, bottom) 2 μm.
Figure 5.
Figure 5.
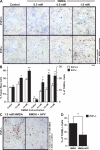
NMDAR-mediated excitotoxic cell death in PrP-null neurons. (A) Light microscope images of neuronal cultures after 20 min of exposure to 0.3, 0.6, and 1.0 mM NMDA followed by 24-h recovery. Cells were stained with trypan blue (dark blue) and TUNEL (brown); methyl green was used as the counterstain. (B) Mean cell counts for trypan blue– and TUNEL-stained cells in WT and PrP-null cultures. (C) Light microscope images showing TUNEL-stained neurons from PrP-null mice in the presence of NMDA and NMDA + APV. (D) Percentage of TUNEL-positive neurons from PrP-null mice in response to NMDA and NMDA + APV. The drug concentrations were 1 mM NMDA and 100 μM APV. Data are represented as mean ± SEM (error bars), with statistical significance denoted as *, P < 0.05 and **, P < 0.001. Data were obtained from four culture rounds, and six random fields were imaged per condition. Bar, 100 μm.
Figure 6.
Figure 6.
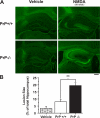
Increased excitotoxic cell death and lesion size in the hippocampus of PrP-null mice in response to in vivo transient NMDA exposure. (A) Fluoro-Jade labeling of neuronal bodies and processes in hippocampal sections in response to injection of vehicle (left) or NMDA (10-nmol equivalent; right). (B) Quantification of lesion size relative to the hippocampus over a series of three to six sections per animal (n = 5 per experimental group). Data are represented as mean ± SEM (error bars), with statistical significance denoted as **, P < 0.001. Bar, 200 μm.

Republished in

Comment in

References

    1. Altier, C., H. Khosravani, R.M. Evans, S. Hameed, J.B. Peloquin, B.A. Vartian, L. Chen, A.M. Beedle, S.S. Ferguson, A. Mezghrani, et al. 2006. ORL1 receptor-mediated internalization of N-type calcium channels. Nat. Neurosci. 9:31–40. - PubMed
    1. Arundine, M., and M. Tymianski. 2004. Molecular mechanisms of glutamate-dependent neurodegeneration in ischemia and traumatic brain injury. Cell. Mol. Life Sci. 61:657–668. - PMC - PubMed
    1. Brown, D.R. 2001. Prion and prejudice: normal protein and the synapse. Trends Neurosci. 24:85–90. - PubMed
    1. Brown, D.R., J.W. Herms, B. Schmidt, and H.A. Kretzschmar. 1997. PrP and beta-amyloid fragments activate different neurotoxic mechanisms in cultured mouse cells. Eur. J. Neurosci. 9:1162–1169. - PubMed
    1. Bueler, H., M. Fischer, Y. Lang, H. Bluethmann, H.P. Lipp, S.J. DeArmond, S.B. Prusiner, M. Aguet, and C. Weissmann. 1992. Normal development and behaviour of mice lacking the neuronal cell-surface PrP protein. Nature. 356:577–582. - PubMed

Publication types

MeSH terms