. 2008 May;40(5):499-507.
doi: 10.1038/ng.127.

An embryonic stem cell-like gene expression signature in poorly differentiated aggressive human tumors

Affiliations

An embryonic stem cell-like gene expression signature in poorly differentiated aggressive human tumors

Ittai Ben-Porath et al. Nat Genet. 2008 May.

Abstract

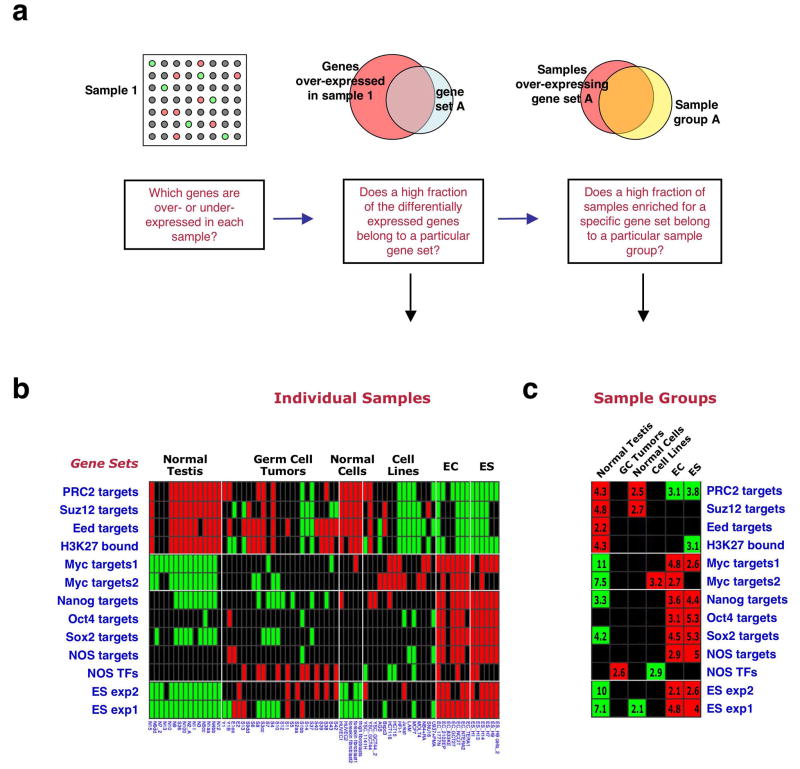
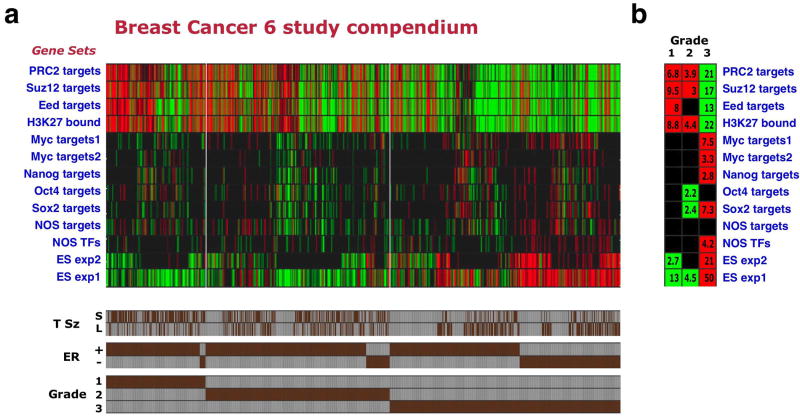
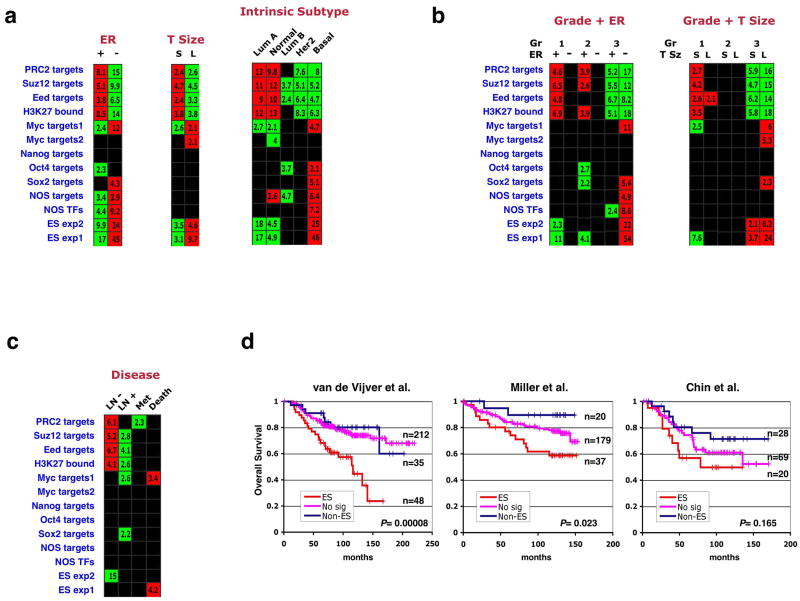
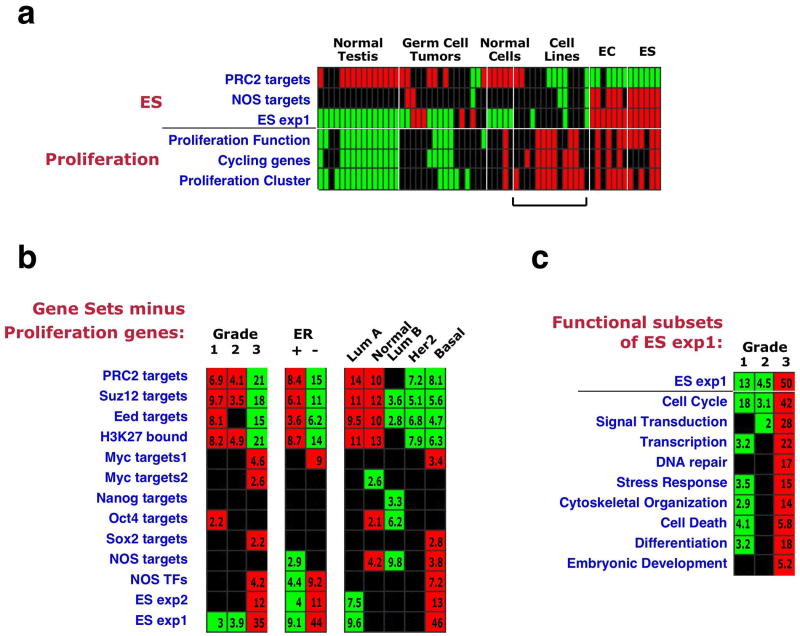
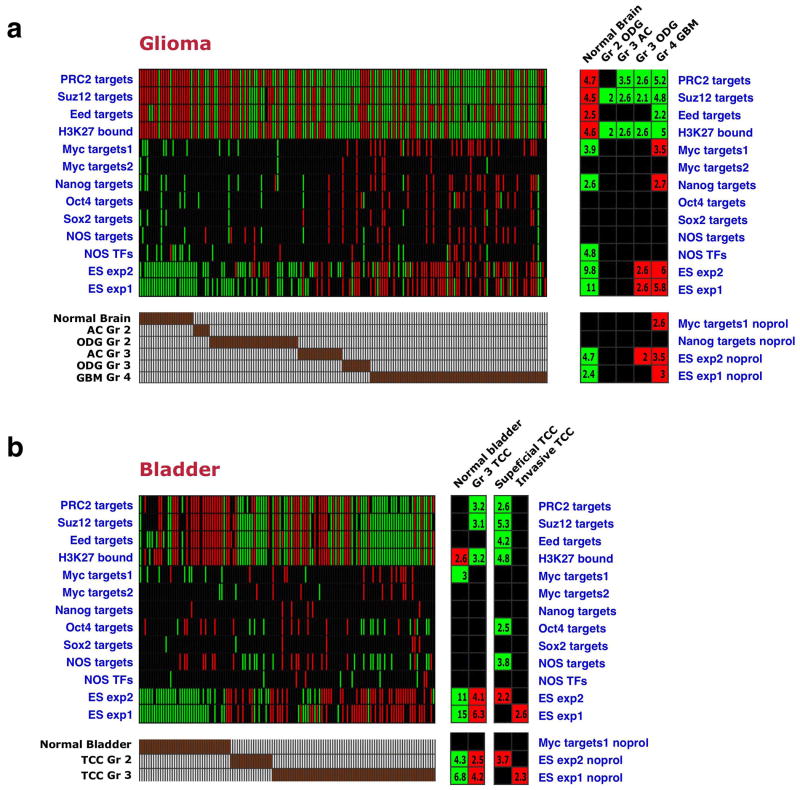
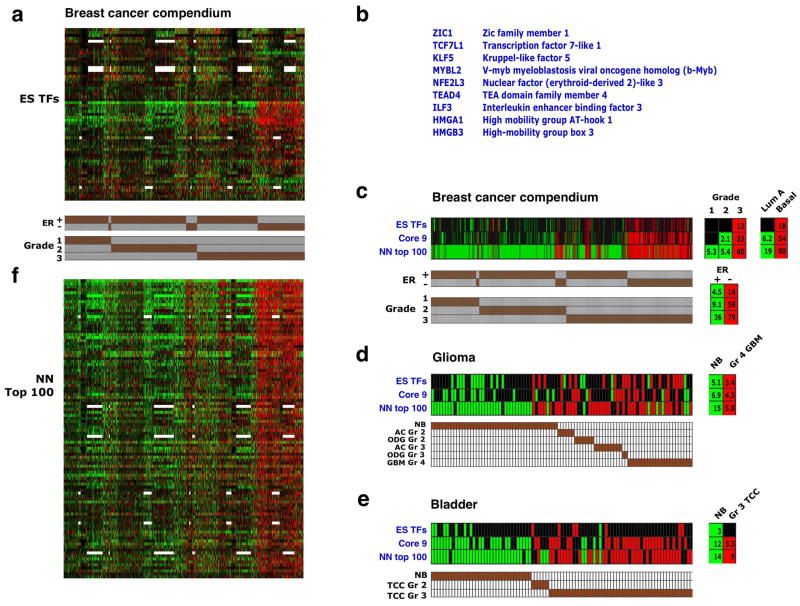
Cancer cells possess traits reminiscent of those ascribed to normal stem cells. It is unclear, however, whether these phenotypic similarities reflect the activity of common molecular pathways. Here, we analyze the enrichment patterns of gene sets associated with embryonic stem (ES) cell identity in the expression profiles of various human tumor types. We find that histologically poorly differentiated tumors show preferential overexpression of genes normally enriched in ES cells, combined with preferential repression of Polycomb-regulated genes. Moreover, activation targets of Nanog, Oct4, Sox2 and c-Myc are more frequently overexpressed in poorly differentiated tumors than in well-differentiated tumors. In breast cancers, this ES-like signature is associated with high-grade estrogen receptor (ER)-negative tumors, often of the basal-like subtype, and with poor clinical outcome. The ES signature is also present in poorly differentiated glioblastomas and bladder carcinomas. We identify a subset of ES cell-associated transcription regulators that are highly expressed in poorly differentiated tumors. Our results reveal a previously unknown link between genes associated with ES cell identity and the histopathological traits of tumors and support the possibility that these genes contribute to stem cell-like phenotypes shown by many tumors.


Figures

Figure 1
Figure 1. An ES cell gene-set enrichment pattern
(a) Analysis method of gene set enrichment pattern. For each sample (array) genes over- and under- expressed relative to the mean across samples are scored. The fraction of these differentially expressed genes that belong to each of the tested gene sets is then calculated, and its significance over random is estimated, producing a P value. In the second step of the analysis, the over-representation of particular sample groups among the samples enriched for each gene set is assessed. (b) Gene set enrichments in ES cells compared to other cell types. Columns represent individual samples (sample annotations on bottom), sample group names are indicated above. Rows represent individual gene sets (names indicated on left). Red – gene-set enrichment for overexpression, green - gene-set enrichment for underexpression, black – no significant enrichment. (c) Enrichment pattern across sample groups. Numbers indicate P-values for gene set enrichment significance within sample group, in negative log, e.g., 4 symbolizes P=10-4.
Figure 2
Figure 2. Poorly differentiated breast cancers display an ES-like enrichment pattern
(a) Enrichment pattern of indicated gene sets (rows) across 1,211 breast cancer samples included in 6 profiling studies (columns). Red/green – significantly over- or underexpressed gene sets. Shown are 1,089 tumors for which both ER status and grade annotations were available. Brown bars (bottom) indicate individual tumor annotations for grade, ER status, and tumor size (T Sz), where available. S – tumor smaller than 2cm across (pathological T1), L – tumor larger than 2cm (pathological T2 or T3). (b) Gene set enrichments in the breast compendium tumors stratified by tumor grade.
Figure 3
Figure 3. Association of the ES signature with ER status, tumor size, intrinsic subtype, and prognostic outcome in breast cancers
(a) Gene set enrichments in the breast compendium tumors stratified by ER status, tumor size (T Size) or intrinsic subtype. Stratification for the latter parameter was done by employing an expression-profile based classification method,. S – small, L – large, Lum – luminal. (b) Samples were divided into six groups representing different combinations of tumor grade and ER-status, and enrichment of gene sets was tested across these groups (left). A similar analysis was performed for grade and tumor size (right). (c) Enrichments in tumors stratified by lymph-node metastasis absence (LN-) or presence (LN+), distant metastasis (Met), or disease-induced mortality (Death). (d) Kaplan-Meier analyses of overall survival in patients included in three of the five studies analyzed. Patients showing both overexpression of the ES exp1 set and underexpression of the PRC2 targets set were labeled as ES (red), those showing the reversed pattern were labeled as Non-ES (blue), and the remainder were labeled as No signature (No sig, pink). P values indicate significance of survival difference between the ES patient group and all other patients.
Figure 4
Figure 4. Contribution of proliferation-associated genes to the ES signature
(a) Enrichment patterns in individual samples of ES cells and other cell types of the indicated ES gene sets (as in Fig. 1), and of three Proliferation gene sets: Proliferation Function - genes functionally associated with cell proliferation (compiled from several GO categories), Cycling Genes – genes showing cell-cycle stage-specific expression, Proliferation Cluster – defined in tumor expression data. Bar indicates difference in enrichment pattern between ES gene sets and proliferation gene sets in cultured tumor cell lines. (b) Gene set enrichment patterns across grade, ER-status and intrinsic subtypes after subtraction of the Proliferation Function genes from all gene sets. Subtraction of the two other proliferation sets is shown in Supplementary Fig. 2. (c) Enrichment pattern across grade of different subsets of the ES exp1 gene set, based on their cellular function (GO).
Figure 5
Figure 5. ES signature in high-grade glioblastomas and bladder carcinomas
(a) Gene set enrichment pattern across 157 normal brain and glioma samples of various subtypes (bottom). Gene sets subtracted for proliferation genes are indicated as noprol. ODG – oligodendroglioma, AC- astrocytoma, GBM – glioblastoma multiforme. (b) Gene set enrichment pattern across normal bladder samples and grade 2 and 3 transitional cell carcinomas (TCC). Invasive TCCs represent a tumor stage more advanced than superficial tumors.
Figure 6
Figure 6. A core set of ES-associated transcription factors is overexpressed in high-grade tumors
(a) Expression pattern of 59 genes encoding ES-associated transcription regulators (rows) across the breast cancer compendium samples (columns), sorted by grade and ER status (indicated in bottom). 12 additional genes in the ES TFs set were not represented in most of the arrays used are therefore not shown. Red/green – two-fold or higher over- or underexpression, respectively. White – missing data. (b) Core set of 9 closely correlated ES transcription regulators, as determined by the pvclust method (Supplementary Figure 4b). (c) Gene set enrichment in the breast cancer compendium samples of the 68 ES-associated transcription regulators (ES TFs), the Core 9 gene subset (Core 9), and top ranking 100 genes in the nearest neighbor expression correlation analysis (NN top 100) – see panel f. Shown are enrichments in individual tumors and in tumors stratified by grade, ER status and intrinsic subtype. Only samples showing enrichment for at least one set are presented. (d) Analysis as in C in glioma samples. NB – normal brain, other annotations as in Figure 5a. (e) Analysis as in C in bladder carcinoma samples. NB – normal bladder, other annotations as in Figure 5b. (f) 1,700 transcription regulators in the human genome were ranked according to the similarity of their expression pattern in the breast cancer compendium to the expression of the Core 9 gene cluster (nearest neighbor analysis). Shown are the top-ranking 100 genes, in rank order (top down).

Similar articles

Cited by

References

    1. Reya T, Morrison SJ, Clarke MF, Weissman IL. Stem cells, cancer, and cancer stem cells. Nature. 2001;414:105–111. - PubMed
    1. Beachy PA, Karhadkar SS, Berman DM. Tissue repair and stem cell renewal in carcinogenesis. Nature. 2004;432:324–331. - PubMed
    1. Stingl J, Caldas C. Molecular heterogeneity of breast carcinomas and the cancer stem cell hypothesis. Nat Rev Cancer. 2007;7:791–799. - PubMed
    1. Lobo NA, Shimono Y, Qian D, Clarke MF. The Biology of Cancer Stem Cells. Annu Rev Cell Dev Biol. 2007 - PubMed
    1. Andres AC, et al. Ha-ras and c-myc oncogene expression interferes with morphological and functional differentiation of mammary epithelial cells in single and double transgenic mice. Genes Dev. 1988;2:1486–1495. - PubMed

Publication types

MeSH terms

Substances